


Crude Oil Analysis, Price and Chart
- Iran and the US remain at loggerheads.
- Oil volatility may increase if tensions increase.

The US and Iran remain at loggerheads over the 2015 nuclear deal with both sides saying that they are willing to return to the table if the other side moves first, something that is looking increasingly unlikely to happen. The US says that Iran must return to its commitments under the deal first, while Iran says that the US must lift the economics sanction placed on them in short-order - according to some reports - if they are to return to the negotiating table. With time seemingly running out, oil volatility may increase over the coming days.
While oil’s medium- to longer-term outlook remains positive as the reflation trade continues, in the short-term there may be a period of consolidation before the next move higher. The recent oil rally may persuade OPEC members to lift output cuts soon to try and find a new level of balance between supply, demand and the price of oil and this is likely to weigh on oil.
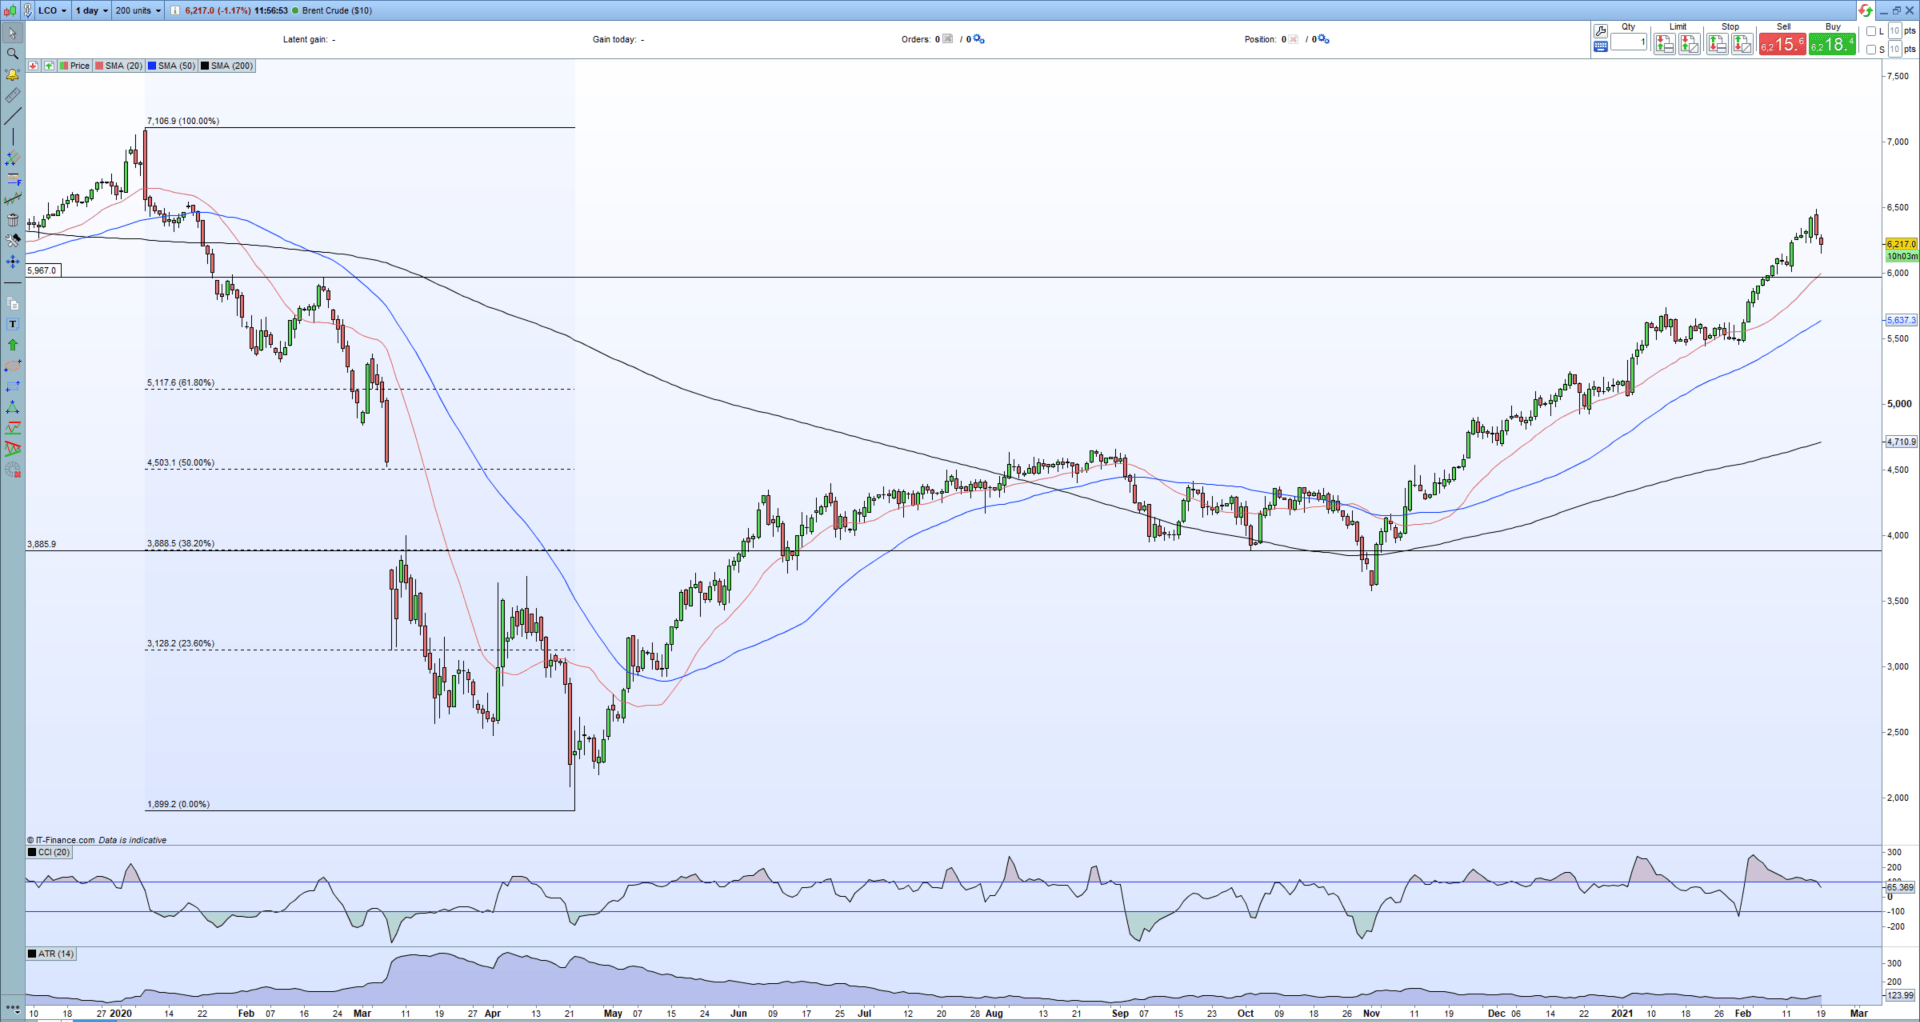
The daily chart shows the steady rally from the April 2020 ‘slump’ low with only a small pull-back in late August/early November breaking the one-way sentiment in oil. Since then the 20-day simple moving average has steered the market ever higher, backed up the 50- and 200-day smas. Short-term support between $59.50/bbl. and $60.00/bbl. should stem any sell-off in the short-term. To the upside, a fresh attempt to break above $65.00/bbl. and then the recent high print at $71.07/bbl. may prove harder, especially if OPEC members look to increase production as economies around the world begin to expand at a greater rate.
Brent Crude Oil Price Chart (January 2020 – February 19, 2021)
| Change in | Longs | Shorts | OI |
| Daily | -2% | -7% | -3% |
| Weekly | 20% | -25% | 3% |
IG retail trader datashow 48.93% of traders are net-long with the ratio of traders short to long at 1.04 to 1.We typically take a contrarian view to crowd sentiment, and the fact traders are net-short suggests Oil - US Crude prices may continue to rise.Yet traders are less net-short than yesterday and compared with last week. Recent changes in sentiment warn that the current Oil - US Crude price trend may soon reverse lower despite the fact traders remain net-short.
What is Market Sentiment and How Does it Work?
What is your view on Oil – are you bullish or bearish?? You can let us know via the form at the end of this piece or you can contact the author via Twitter @nickcawley1.


