


S&P 500, NIKKEI 225, ASX 200 INDEX OUTLOOK:
- Asia-Pacific stocks are poised for a mixed start as US equities hovered at record highs
- Democrats are pushing through a US$ 1.9 billion relief package with broadened eligibility to stimulus cheques
- Treasury yields retreated alongside the US Dollar Index (DXY) ahead of key inflation data from China, Germany, and the US

US Stimulus, Inflation, Yields, Asia-Pacific at Open:
Asia-Pacific markets are poised for a mixed start on Wednesday after the rally on Wall Street took a pause. The S&P 500 and Dow Jones indices closed -0.11% and -0.06% lower, while the Nasdaq Composite edged 0.14% higher. Markets appeared to have largely priced in the US$ 1.9 trillion Covid-relief package, which is crucial to revitalize consumer spending, assist vaccine rollouts and foster a faster economic recovery for the US. President Joe Biden is backing Democrats’ proposal to broaden the eligibility of stimulus payments for middle-income households. Individuals earning up to 75k and couples earning 150k annually may be able to receive US$ 1,400 cheque payments.
The VIX volatility index fell to 21.6 from a recent peak of 37.3 (January 27th), suggesting that the S&P 500 index may have resumed its ‘one-way’ trajectory. The DXY US Dollar index also retreated to 90.95 on stimulus hopes, and it may serve to boost commodity prices alongside emerging market stocks and currencies. The 10-year US Treasury yield fell slightly to 1.16% from a recent high of 1.20%, although the overall trend remains ascending.
On the macro front, inflation data from China, Germany and the US are among key events today. China’s January CPI is expected to be flat YoY due to sluggish consumption and lockdown measures imposed in some northern provinces. A lack of inflation may assure the PBOC’s neutral stance in terms of monetary policy. US core CPI YoY data is expected to fall slightly to 1.5% in January from 1.6% observed in December, showing little signs of overheating. Yet, a large deviation from the baseline forecast can potentially lead to a spike in volatility. Find out more from the DailyFX calendar.

Source: DailyFX
Australia’s ASX 200 index opened 0.5% higher, led by energy (+1.06%), materials (+0.96%) and utilities (+0.83%) sectors, while consumer discretionary (-0.46%) and health care (-0.13%) lagged. Japan’s Nikkei 225 index looks set to retreat slightly from its 3-decade high of 29,585 as profit-taking activity kick in. The index gained 6.8% so far in February, making it one of the best performing Asia-Pacific indices month-to-date.
Sectoral performance was quite mixed overnight. 6 out of 11 S&P 500 sectors ended higher, with 46.9% of the index’s constituents closing in the green. Real estate (+0.47%), industrials (+0.21%) and communication services (+0.21%) were among the better performers, whereas energy (-1.52%) and materials (-0.69%) were trailing.
S&P 500 Sector Performance 09-02-2021

Source: Bloomberg, DailyFX
S&P 500 Index Technical Analysis
The S&P 500 index returned to an “Ascending Channel” last week after briefly dipping below it. The index has likely resumed its upward trajectory, which is well supported by the upward-sloped 20-, 50- and 100-Day Simple Moving Average (SMA) lines. The index breached above the 100% Fibonacci extension level and thus has likely opened the door for further upside potential with an eye on 3,995 (127.2% Fibonacci extension). The MACD indicator formed a bullish crossover, suggesting that near-term momentum has turned bullish.
S&P 500 Index – Daily Chart

Nikkei 225 Index Technical Analysis:
The Nikkei 225 index broke above a key resistance level of 28,740 (61.8% Fibonacci extension) and has likely resumed its upward trajectory. The index has formed higher highs and higher lows since November, suggesting that the bullish trend remains intact. Immediate resistance levels can be found at 29,340 (76.4% Fibonacci extension), followed by 29,500 (upper Bollinger band). Breaching these two levels may open the door for further upside potential with an eye on 30,300 (100% Fibonacci extension). A pullback from here may lead to a test of 28,740.
Nikkei 225 Index – Daily Chart

ASX 200 Index Technical Analysis:
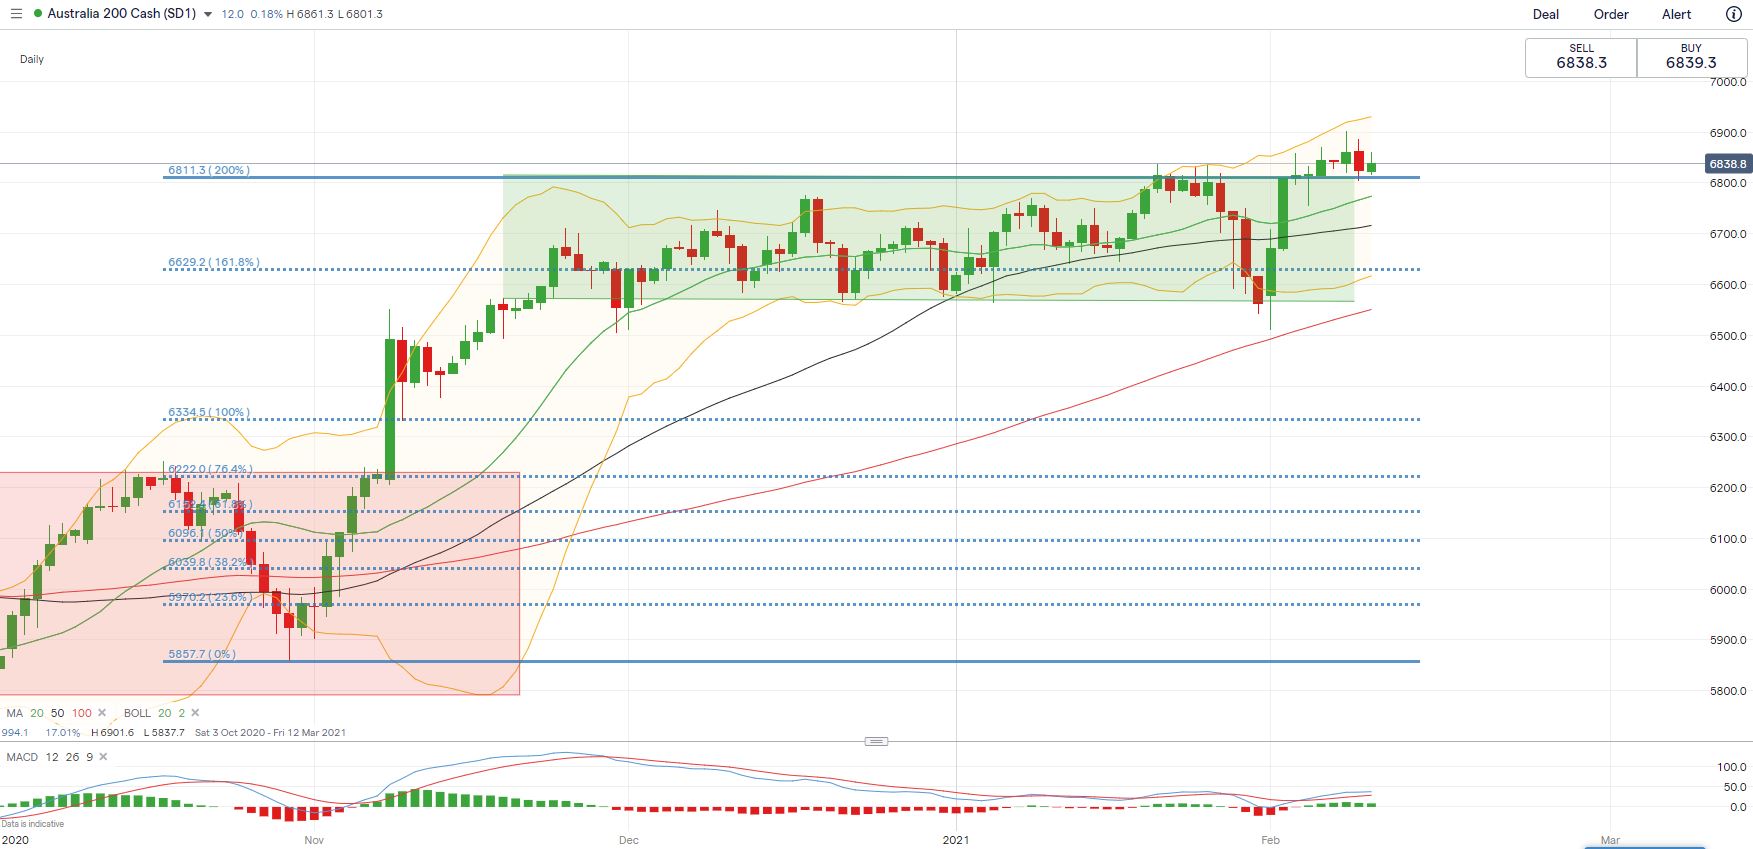
The ASX 200 index broke the ceiling of a “Range-Bound” zoneat 6,810 last week before prices entered a consolidative phase. 6,810 has now became a key support level, holding above which may pave way for further upside potential with an eye on 6,900. The overall trend remains bullish-biased as suggested by the upward-sloped SMAs and widening Bollinger band width.
ASX 200 Index – Daily Chart

--- Written by Margaret Yang, Strategist for DailyFX.com
To contact Margaret, use the Comments section below or @margaretyjy on Twitter


