


Gold Price Outlook:
- Gold trades near the midpoint of a descending channel it has etched since August
- A potential MACD crossover with gold near resistance might open the door to bearish strategies
- Bitcoin vs Gold: Top Differences Traders Should Know
Gold Price Forecast: XAU/USD Runs into Resistance, Will it Reverse Lower?
Gold volatility has been elevated in February with the precious metal bouncing between technical levels in quick succession. While losses suffered earlier in the month have largely been reclaimed, XAU/USD remains near the midpoint of the descending channel it has etched out since August. Despite the recent recovery, the yellow metal has encountered resistance overhead and appears vulnerable to a reversal lower.
Gold (XAU/USD) Price Chart: Daily Time Frame (March 2020 - February 2021)
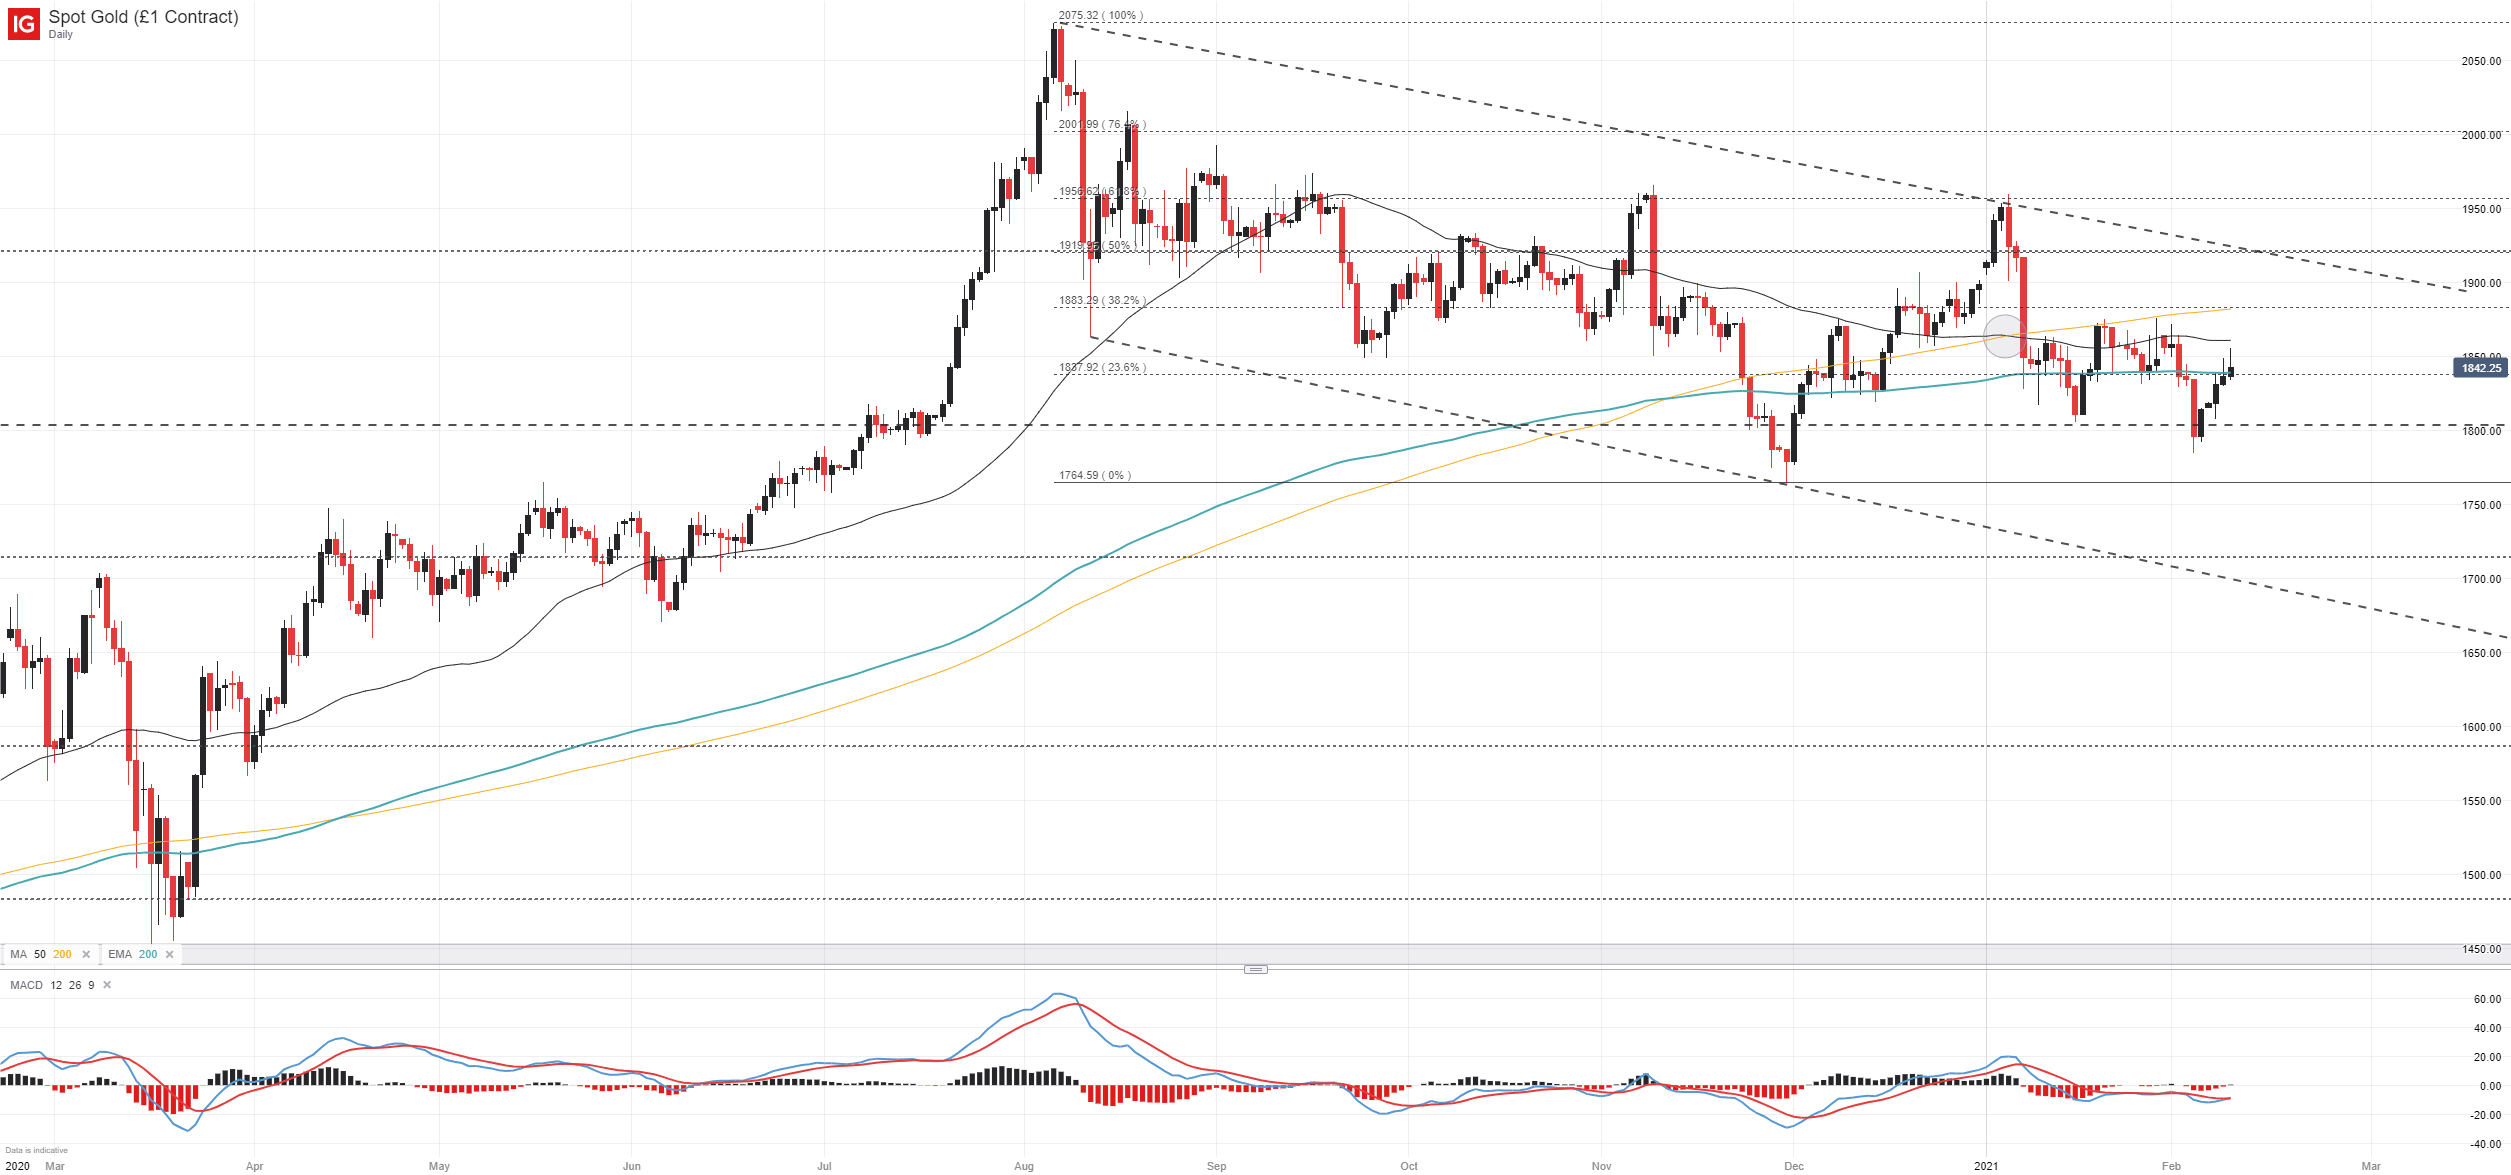
While the fundamental argument for gold – one that was vital to the metal’s climb from March to August – remains intact, the gradual decline in price is undeniable. As a result, longer-term price trends have since become negative, evidenced by a “death cross” formation on the daily chart in early January 2021 and a break beneath the 200 exponential moving average. As it stands, XAU/USD trades beneath all three of these longer-term averages and there is little to suggest gold will suddenly reverse higher and snap the downtrend.
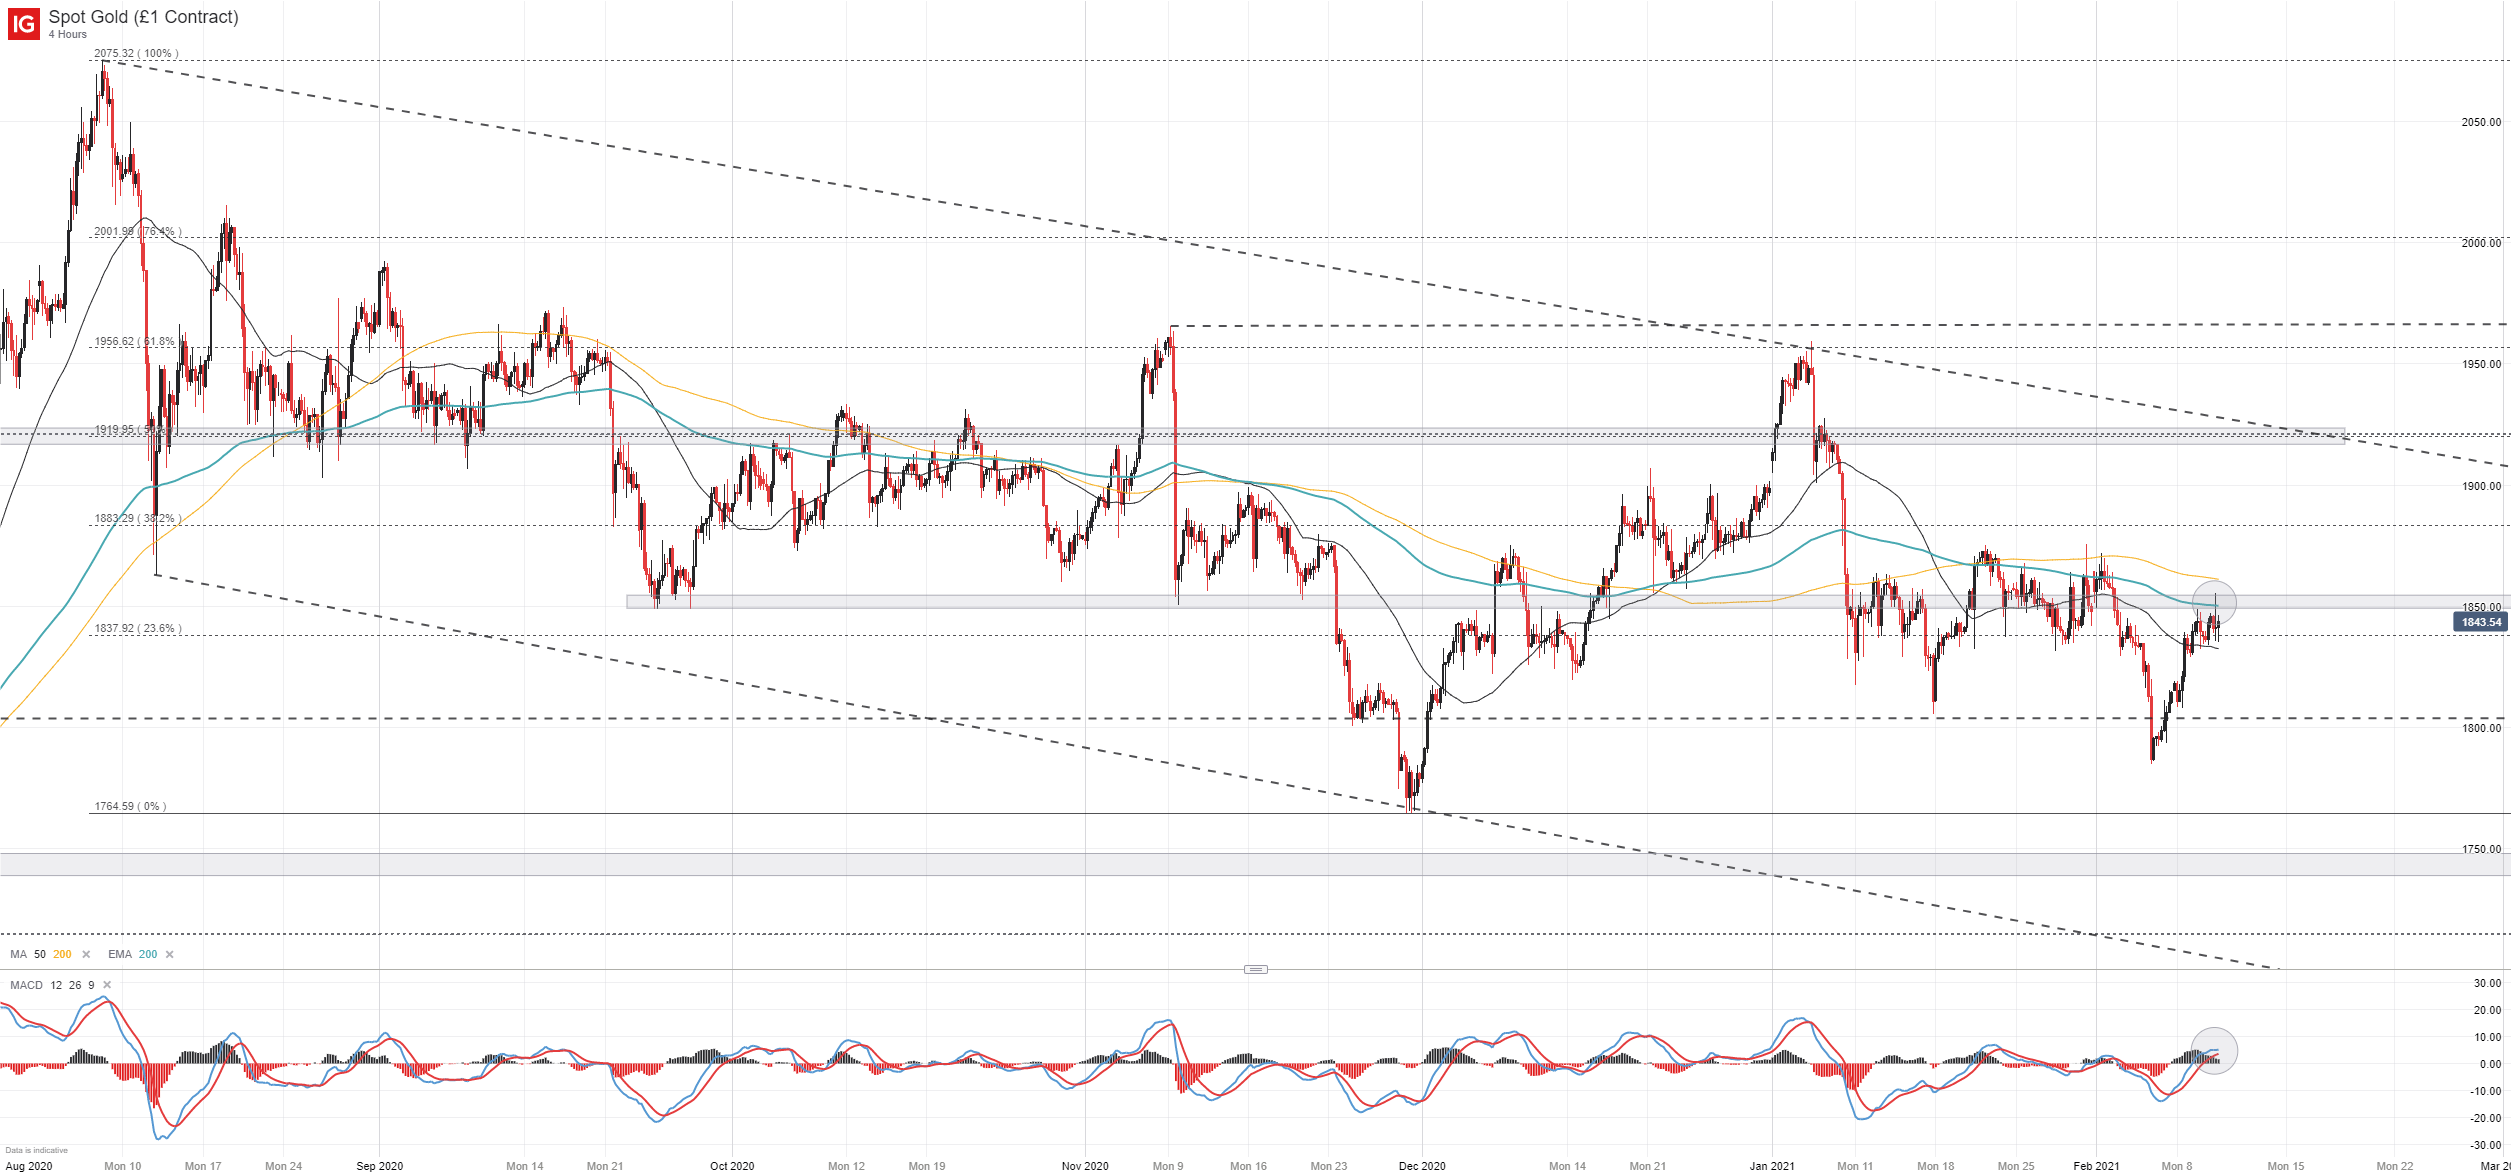
Gold (XAU/USD) Price Chart: 4 – Hour Time Frame (August 2020 - February 2021)
How to Trade Gold: Top Gold Trading Strategies and Tips
Resistance is also evident on the 4-hour chart as gold negotiates the $1850 area which has proved influential in the past. The area also coincides with the 200EMA. A potential MACD crossover above the 0 level and beneath the 200EMA might hint gold could reverse lower in the coming days. That said, a bullish continuation is also possible and subsequent resistance might lie at the Fibonacci levels near $1883 and $1920.
US Equity Outlook and MACD Trading Strategy Walkthrough Video
Still, gold seems susceptible to a gradual continuation lower. With that in mind, areas of interest in the event of a reversal lower might reside near the $1800 mark and slightly beneath at the 2021 swing low near $1784. Follow @PeterHanksFX on Twitter for updates and analysis.

--Written by Peter Hanks, Strategist for DailyFX.com
Contact and follow Peter on Twitter @PeterHanksFX


