


Dow Jones & Crude Oil Price Outlook:
- The Dow Jones trades at record levels alongside the S&P 500 and Nasdaq 100
- Reflation hopes have propelled crude oil prices higher, leading to a subsequent uptick in energy stocks
- Stock Market Forecast: Earnings and Volatility Set to Continue in February
Dow Jones & Crude Oil Forecast: Will a Crude Breakout Boost the Dow?
The Dow Jones trades at record levels once again after recovering from market turbulence in late January. Not to be outdone, crude oil prices have climbed to their highest levels since January 2020. Encouragingly for the Dow, the recent breakout in the fossil fuel should serve as a tailwind for energy stocks and could translate into greater gains for indices with energy exposure.
Crude Oil Price Chart: Daily Time Frame (September 2018 – February 2021)

That said, the Dow Jones Industrial Average is not what it once was and its exposure to energy has slowly dwindled in recent years. The fall from grace suffered by energy stocks was acutely exemplified when Exxon Mobil (XOM) was removed from the Industrial Average in August 2020 after holding a spot on the index since 1928. XOM shares have outperformed the broader market in the year-to-date, but this outperformance has not been shared with the Dow Jones.
Dow Jones and Exxon Mobil (XOM) Price Chart: Daily Time Frame (January 2020 – February 2021)
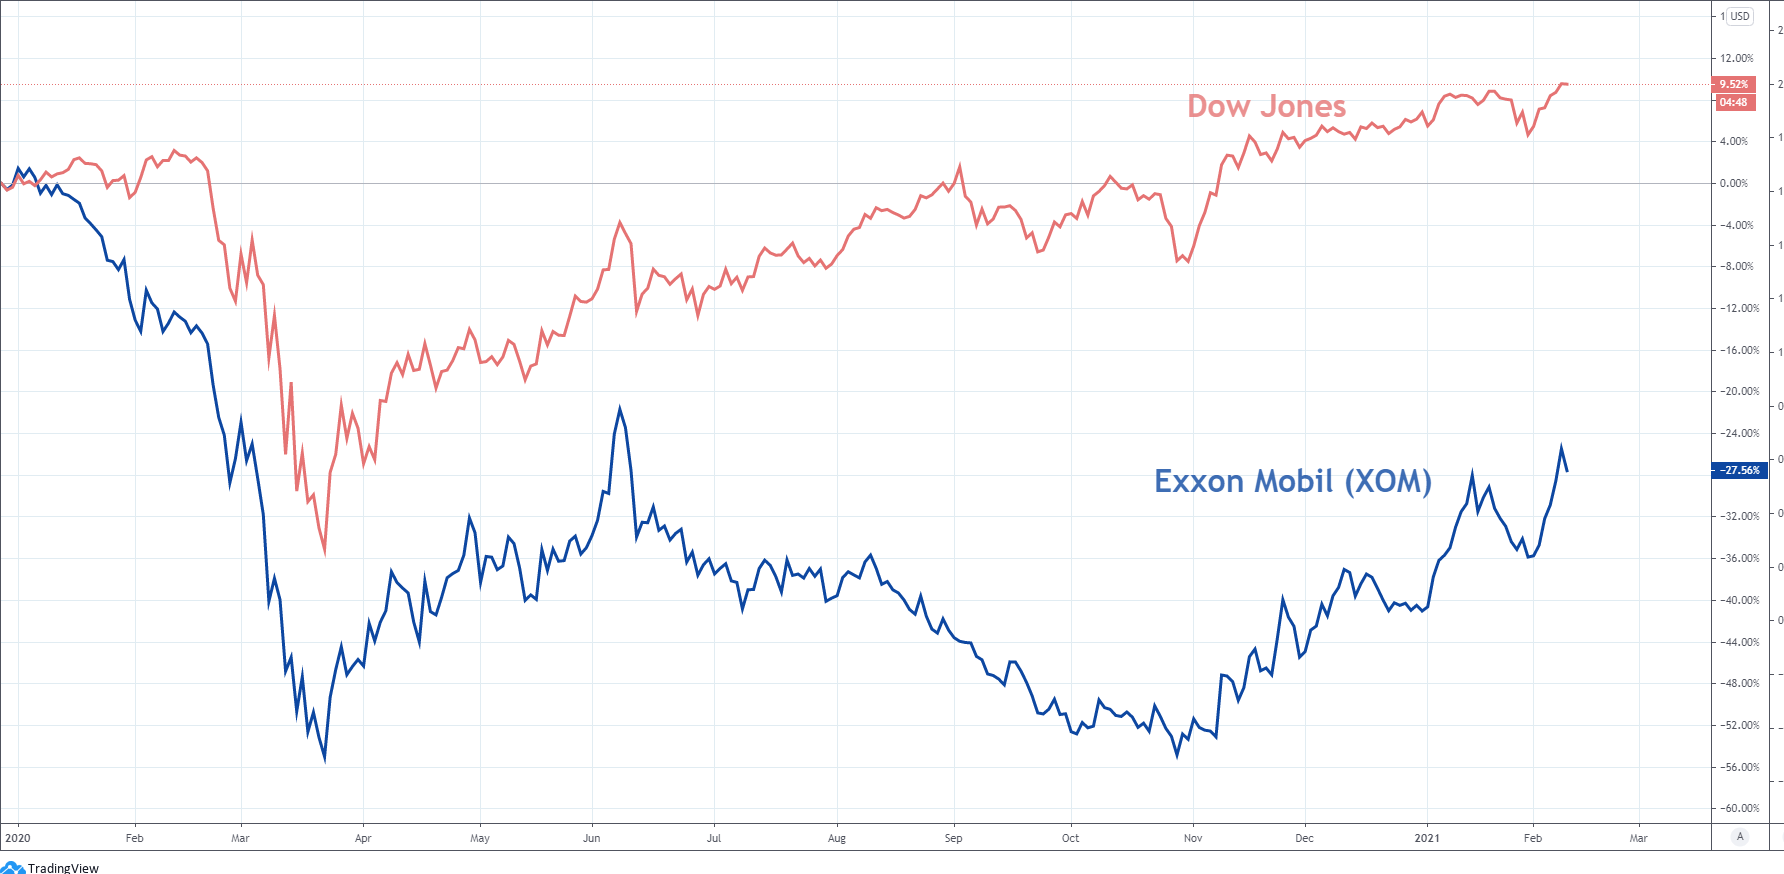
With that in mind, traders searching for exposure to energy stocks in the event crude oil looks to climb higher might find tighter correlations in single stocks or the exchange traded funds like XLE.
Dow Jones, Exxon Mobil, USD/CAD Price Chart: Daily Time Frame (January 2020 - February 2021)
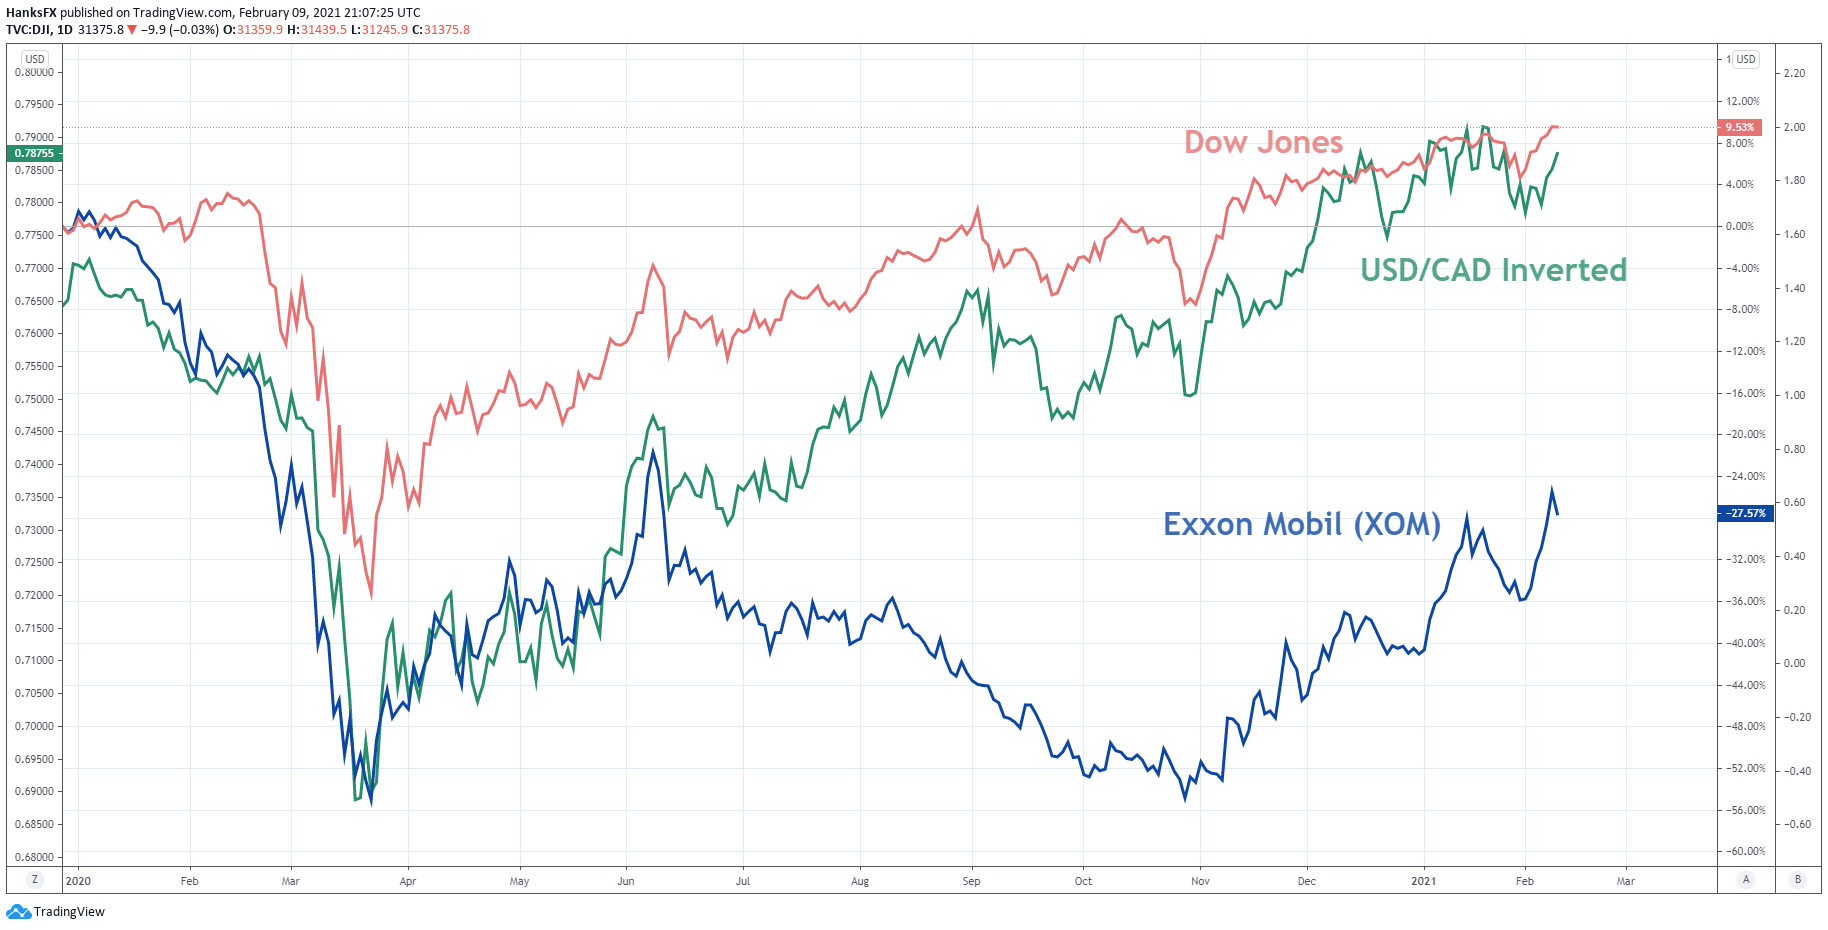
Further still, USD/CAD typically enjoys an inverse correlation with crude oil, meaning if crude prices continue to rise, the pair may fall under pressure. Combined with the reversal in recent USD strength, USD/CAD might serve as a potential proxy for macro traders looking to ride crude oil strength. In the meantime, follow @PeterHanksFX on Twitter for updates and analysis.
| Change in | Longs | Shorts | OI |
| Daily | -13% | 15% | 2% |
| Weekly | 42% | -17% | 0% |
--Written by Peter Hanks, Strategist for DailyFX.com
Contact and follow Peter on Twitter @PeterHanksFX


