


GOLD PRICE OUTLOOK:
- Gold prices fell as much as 1.2% before paring most losses amid broad ‘risk-off’ sentiment
- A stronger USD appears to be weighing on precious metal prices while Treasury yields are steady
- 85% of retail gold traders (within IG)are net long, whereas 15% are net short

Gold prices plunged to a six-week low of US$ 1,805 before bouncing back quickly on Monday. The rising US Dollar and uncertainties surrounding US President-elect Biden’s 1.9 trillion stimulus plan appear to be the primary weighing factors. Market sentiment is tilted towards the cautious side after US equities pulled back from their recent highs despite robust corporate earnings. As US markets are closed for a public holiday, thinner liquidity conditions could exacerbate price volatility.
US Treasury yields have receded from their recent highs, alleviating pressure on precious metals. A sudden jump in longer-dated rates in the past two weeks have caused precious metal prices to plunge sharply (chart below). Rising yields translate into higher “risk-free” rates of return, which make it more expensive to hold the non-interest-bearing yellow metal and thus entice liquidation. Therefore, gold traders may keep an eye on Treasuries for clues about on-coming price moves. Gold and the 10-year US Government bond yield demonstrate a negative relationship, with their 12-month correlation coefficient found at -0.52 (chart below).
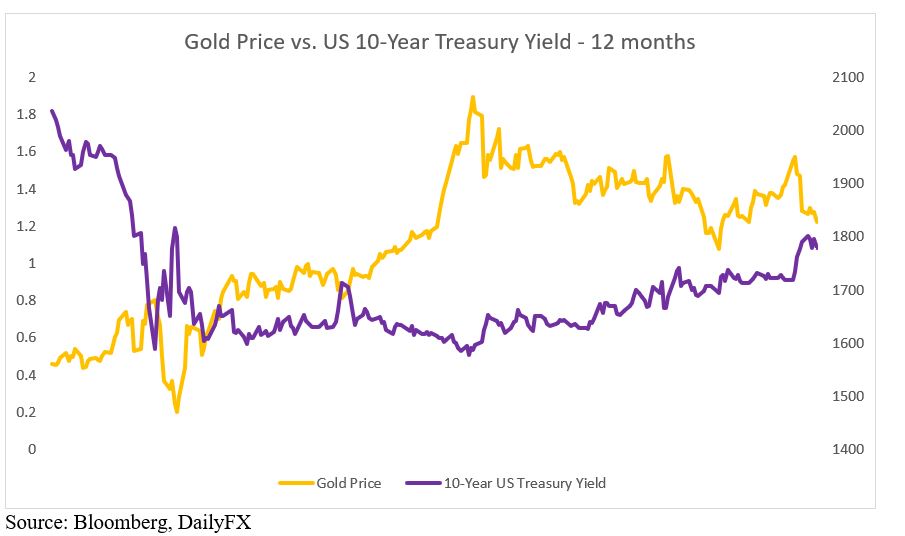
Source: Bloomberg, DailyFX
The US Dollar Index advanced to 90.83 – the highest level seen in more than a month. Doubts surrounding US stimulus plans alongside rising demand for safety may be contributing to the Dollar’s strength. DXY has broken above the 50-Day Simple Moving Average (SMA) line for the first time in two-and-half months. Further strengthening may continue to exert downward pressure on precious metals.
Gold and the Greenback have exhibited a negative relationship, with a correlation coefficient of -0.80 over the past 12 months.
Gold Prices vs. DXY US Dollar Index – 12 Months
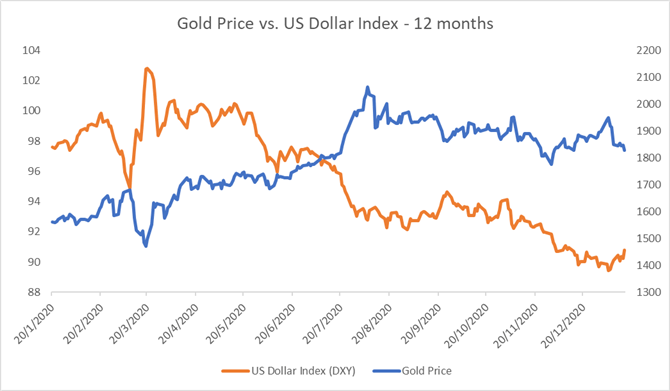
Source: Bloomberg, DailyFX
Last week, the world’s largest gold ETF - SPDR Gold Trust (GLD) – saw its shares outstanding decease by 1.4 million as redemptions outpaced subscriptions. The number of GLD shares outstanding decreased from 405.7 to 403.7 million for the week ending January 15th 2021. This suggests that a temporary pick-up in gold demand is fading quicklyamong ETF investors. Gold prices and the number of outstanding GLD shares have exhibited a strong positive correlation of 0.95 over the past 12 months (chart below).
Gold Price vs. GLD ETF Shares Outstanding – 12 Months
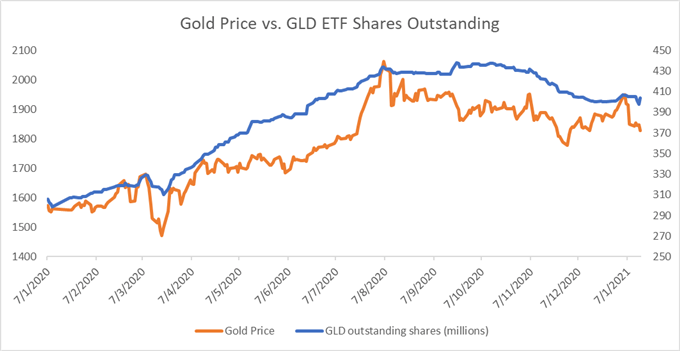
Source: Bloomberg, DailyFX
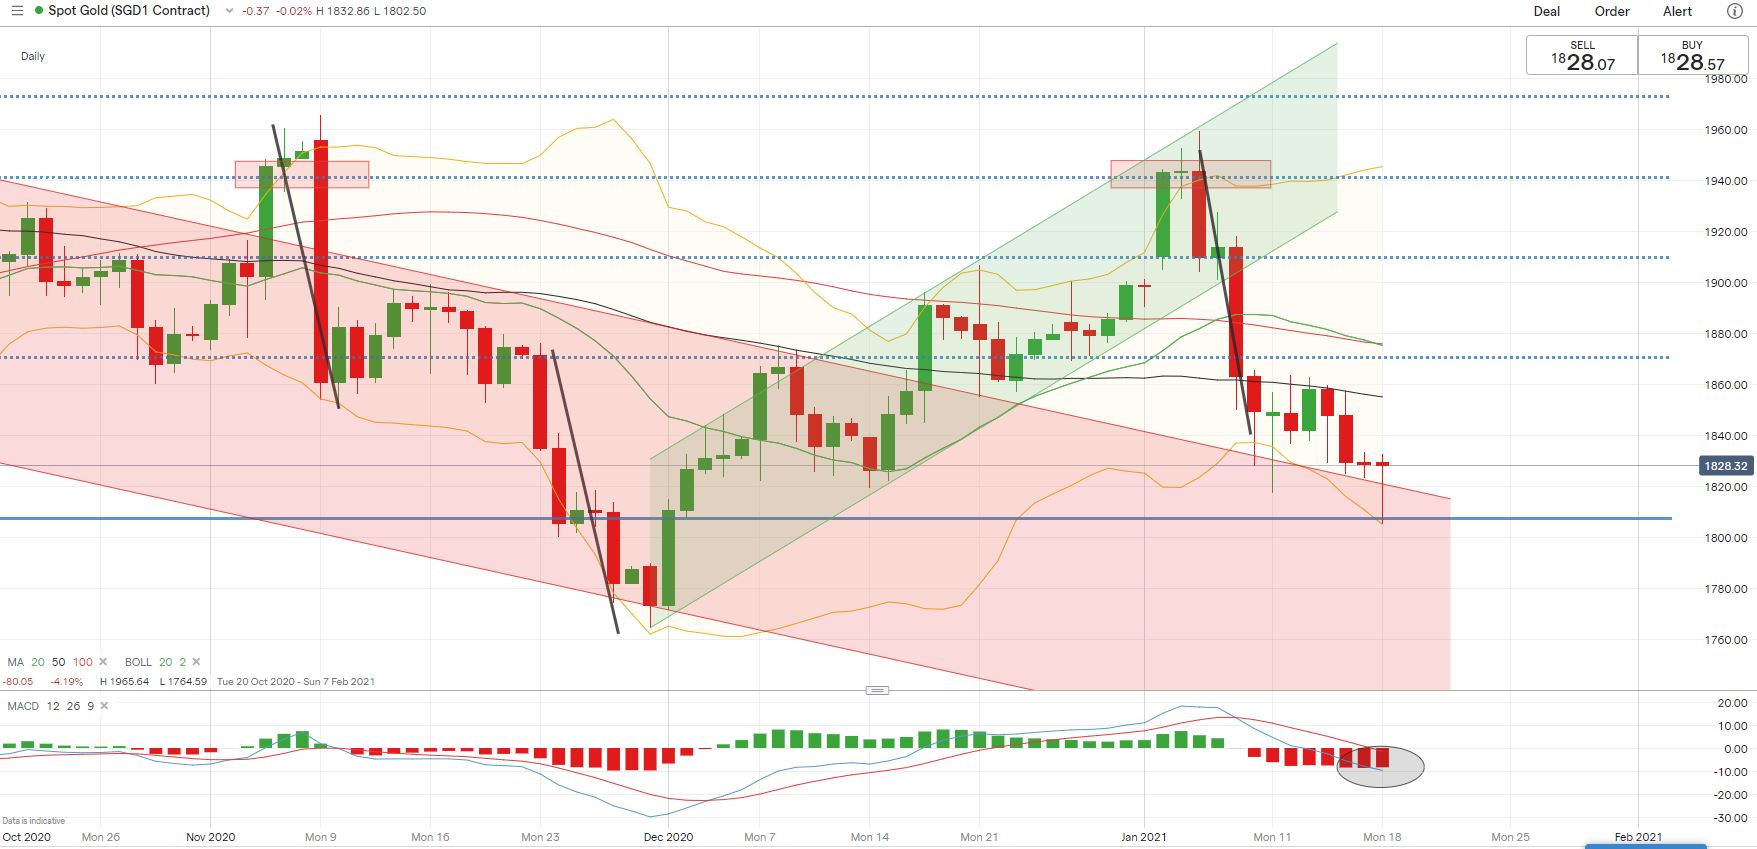
Technically, gold prices remain in a bearish setup after breaking below the “Ascending Channel” in early January (chart below). Prices have likely found some near-term support at around US$ 1,807 – where the lower Bollinger Band and a previous support level intercept. The MACD indicator is trending lower, suggesting that bearish momentum might be prevailing in the near term. Breaking below the US$ 1,807 support may open the door for further losses with an eye on US$ 1,770 – the previous low.
Gold Price – Daily Chart
| Change in | Longs | Shorts | OI |
| Daily | 3% | -5% | -1% |
| Weekly | 12% | 3% | 7% |
IG Client Sentiment indicates that retail gold traders are leaning heavily towards the long side, with 85% of positions net long, while 15% are net short. Traders have increased short positions (+10%) while reducing long exposure (-6%) overnight. Compared to a week ago, traders have increased both short (+14%) and long (+7%) bets.
--- Written by Margaret Yang, Strategist for DailyFX.com
To contact Margaret, use the Comments section below or @margaretyjy on Twitter


