


NATURAL GAS (HENRY HUB) ANALYSIS
- Weather, supply and logistical constraints aiding strengthening LNG prices
- Focus for the week: Weekly storage report scheduled tomorrow
2021 has been a positive year for LNG spot prices with several factors contributing to it’s upward trajectory. Demand for the commodity has risen particularly in Asia and Europe due to cooler than expected weather conditions. Coupled with the last EIA storage report (see below) which shows a marked reduction (-130) in LNG stocks from December. These factors provided additional LNG price stimulus for January however, tomorrows storage data (10:30 EST) should give an insight into the increased demand on current stocks.
Weekly Natural Gas storage report:

Source: EIA – U.S. Energy Information Administration

This increase in demand has put added pressure on supply as well as logistical capabilities. A shortage of LNG tankers has resulted in exorbitant transportation costs which naturally translates to the final price of the commodity. This interruption in the supply chain does not stop at tanker shortages but congestion present in the Panama Canal has forced tankers to find alternate routes to Asia. These routes are longer which increases travel time and ultimately does not meet demand needs.
Enhance your knowledge on Natural Gas with my Top Trading Strategies and Tips !
NATURAL GAS TECHNICAL ANALYSIS
Natural Gas daily chart:
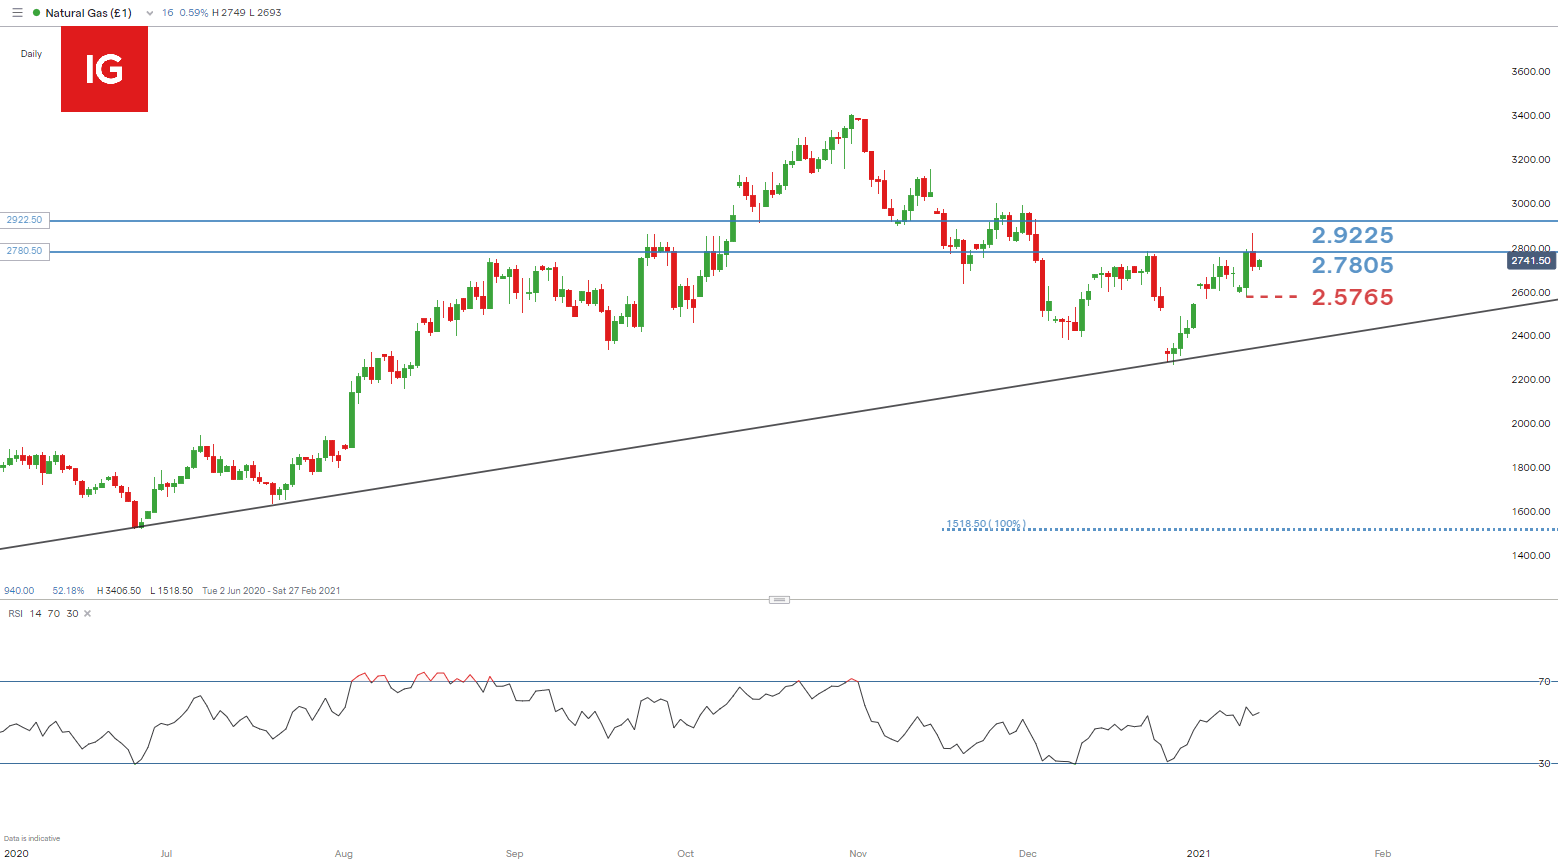
Chart prepared by Warren Venketas, IG
From the end of December up until now, Natural Gas prices have moved roughly 20%. Price action suggests a short-term uptrend in the midst of a medium-term downward trend. The June 2020 low marks the beginning of a diagonal support trendline (black) which serves as a key area in the event of further downside.
2.7805 (blue) highlights the recent swing high in December. This horizontal level has not been fully breached with yesterdays long upper wick candle formation indicating price rejection above 2.7805. Tomorrow’s storage report my give bulls the impetus to push above resistance and look toward the long-term area of confluence at 2.9225.
Should resistance hold, further downside may be evident with Monday’s swing low supplying initial support at 2.5765.
Key points to consider:
- Asian and European demand
- Weekly storage data
- Key resistance level breaks
--- Written by Warren Venketas for DailyFX.com
Contact and follow Warren on Twitter: @WVenketas


