


Natural Gas Talking Points
- Natural gas prices extend higher following last week’s bullish performance
- EIA inventory levels move closer to five-year average after 130 Bcf drop
- Technical posture improves with a bullish SMA crossover nearing completion

Natural gas prices rose roughly 2% on Monday after an updated US temperature outlook from the National Weather Service’s Climate Prediction Center bolstered demand expectations. The 8-14 day temperature forecast shows colder than average temperature expectations across the Northwestern United States as being likely.
Record and near record frigid cold temperatures across Northeast Asia late last week are also helping to push prices higher after heating demand sapped inventory levels in the region, leaving suppliers strained and looking outside conventional supply chains to meet demand. The Hong Kong Observatory on Friday issued an uncommon frost warning for the subtropical region, a testament to the cold shock’s severity.
NOAA 8-14 Day Outlook Temperature Probability
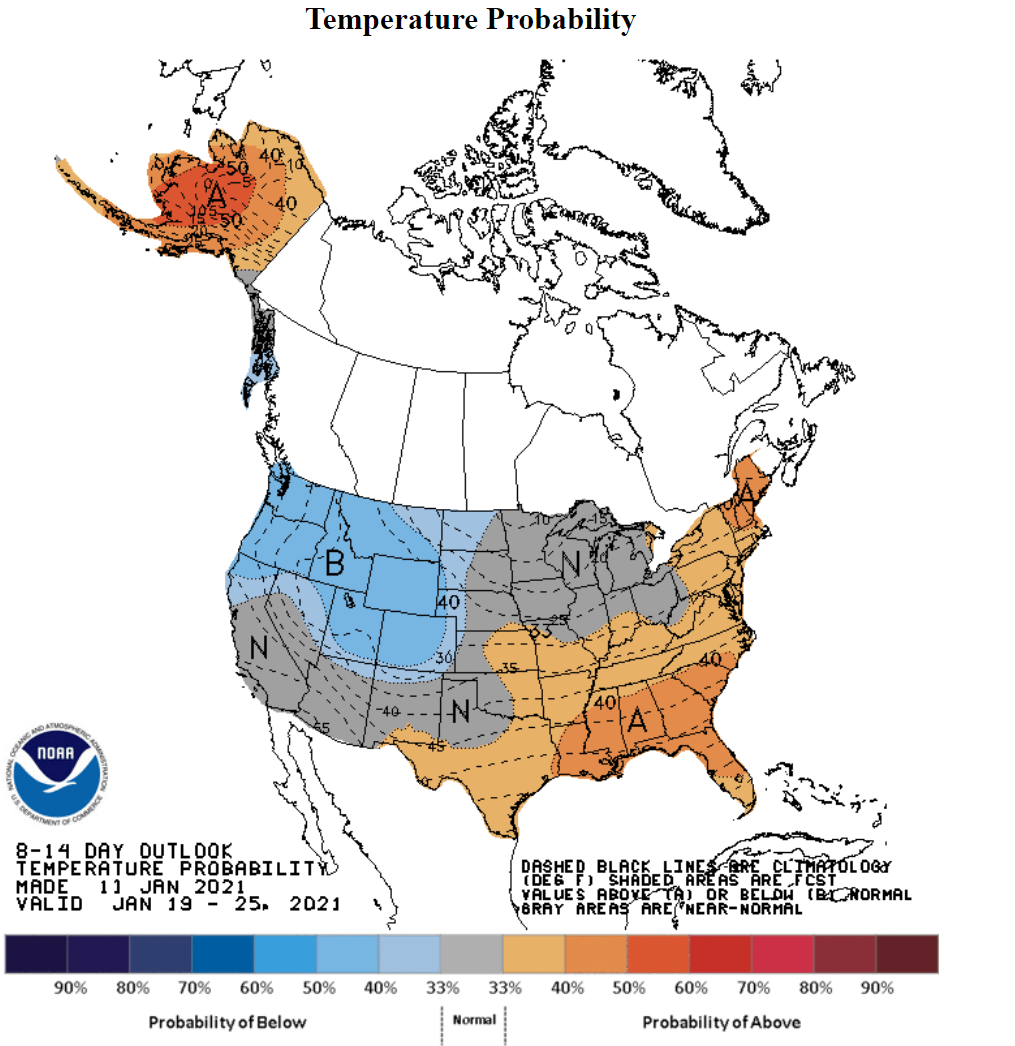
Source: NOAA

The EIA’s Weekly Natural Gas Storage Report for the week ending January 1 shows working gas storage at 3,330 billion cubic feet (Bcf). The inventory report shows a 130 Bcf drop from the prior week, however, levels remain elevated above the five-year average of 3,129 Bcf. Still, the drop in inventory is a bullish sign for prices. According to the DailyFX Economic Calendar, the next EIA report is due out on January 14.
EIA Underground Inventory Levels

Source: EIA
Natural Gas Technical Forecast:
January’s rally is now north of 10%, but bulls still have some way to go after two consecutive months of price declines, with November and December’s losses summating to nearly 25%. A continuation higher looks likely on a technical basis. The MACD line crossed above its zero line on Monday as the daily candlestick pierced above the 38.2% Fibonacci retracement from the September to October move.
The aforementioned Fib level may provide support on a pullback, particularly considering its alignment with the prior swing high from late December. A Simple Moving Average crossover between the 20- and 50-day SMAs is on the verge of forming, a bullish signal that could prompt increased confidence for a move higher. Moreover, the RSI oscillator has plenty of room before an overbought signal is generated, currently just above 58.
Natural Gas Daily Price Chart
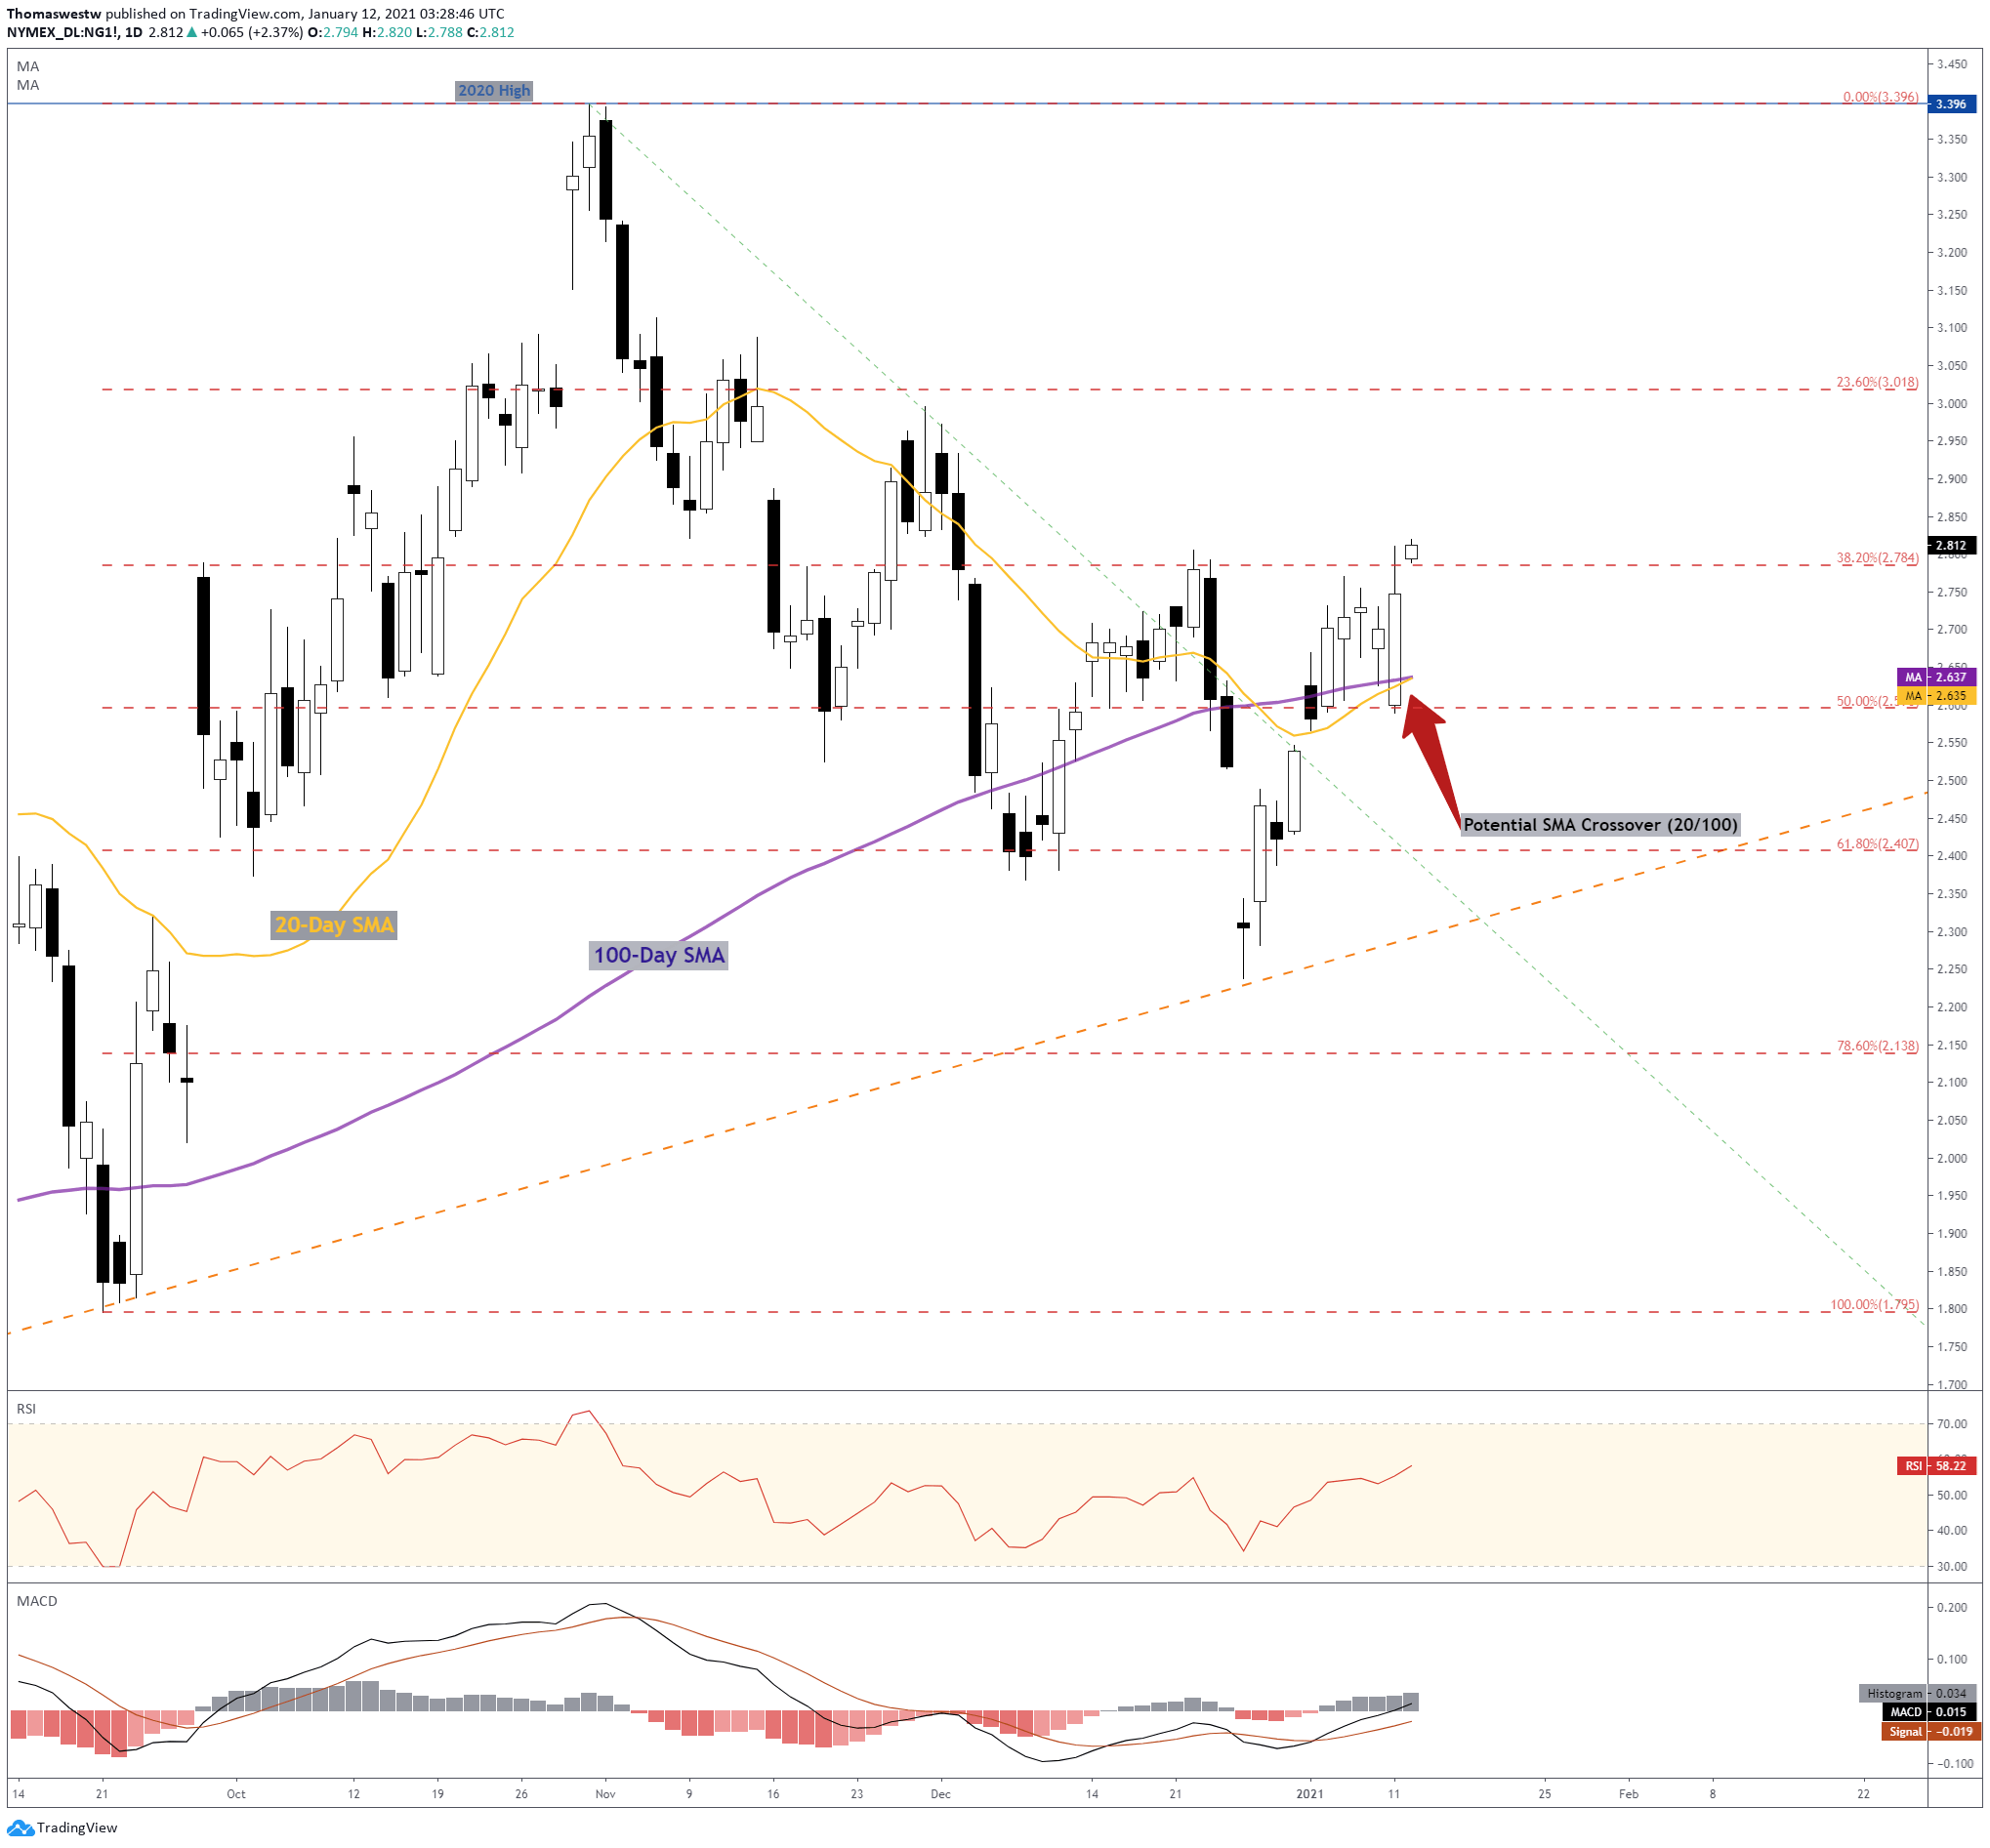
Chart created with TradingView
Natural Gas TRADING RESOURCES
- Just getting started? See our beginners’ guide for FX traders
- What is your trading personality? Take our quiz to find out
- Join a free webinar and have your trading questions answered
--- Written by Thomas Westwater, Analyst for DailyFX.com
To contact Thomas, use the comments section below or @FxWestwater on Twitter


