


GOLD, SILVER PRICE OUTLOOK:
- Gold prices fell as much as 5%, silver slumped nearly 10%over two days
- A stronger USD and rising longer-dated US Treasury yields are among the primary weighing factors
- Gold traders may eye Biden’s stimulus plan for fresh catalysts on this Thursday

Gold and silver prices fell by the most since late September, plunging as much as 5% and 10% respectively over two days. A rebound in the US Dollar and climbing longer-dated US Treasury yields appear to be the primary weighing factors behind the move. Other commodities including iron ore, copper and nickel suffered a pullback too, but not comparable to the extent that gold and silver suffered. This could be attributed to a lack of industrial applications for precious metals compared to base metals, which were riding the tailwind of reflation hopes and a cyclical rebound in industrial demand. This renders precious metal prices more sensitive to yields and the US Dollar.
Rising Treasury yields – perceived risk-free rates of return – increase the opportunity cost for holding non-yielding assets such as gold and silver. Therefore, gold and the 10-year Treasury yield demonstrate a negative relationship, with their 12-month correlation coefficient found at -0.52 (chart below).
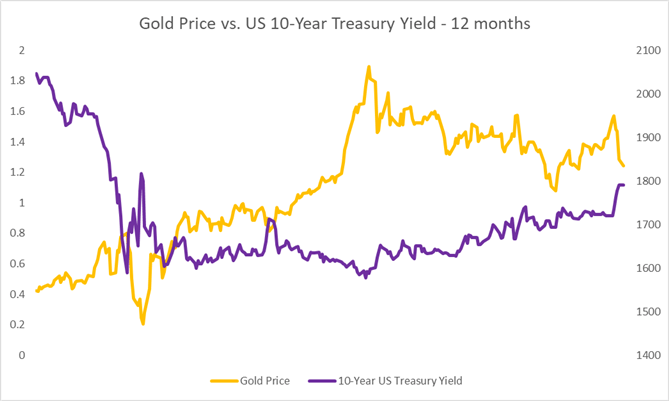
Source: Bloomberg, DailyFX
The US Dollar Index rebounded from a two-and-half year low to 90.40, rising 1.15% over three days. This may partially compensate gold bulls if they used foreign currency to invest in the yellow metal. Last Friday’s US nonfarm payroll report came in with a big miss, and average hourly wages surged 5.1% from a year ago due to large job losses in the leisure and hospitality sector. Worsening labor market conditions in the wake of rapidly rising Covid-19 infections may raise the prospect for further stimulus and monetary easing, which may lead the USD lower in the medium term.
President-elect Joe Biden will unveil a new Covid relief plan this Thursday and may increase the amount of stimulus checks to US$ 2,000 from US$ 600 already approved by Congress and signed by outgoing President Donald Trump. Fresh stimulus hopes may help to cushion the downside for gold and silver prices. The metals have long been perceived as inflation hedge and stores of value amid unprecedented quantitative easing around the globe.
Gold and silver prices have exhibited a negative relationship with the DXY US Dollar index, showing correlation coefficients of -0.80 and -0.92 respectively over the past 12 months.
Silver Prices vs. DXY US Dollar Index – 12 Months
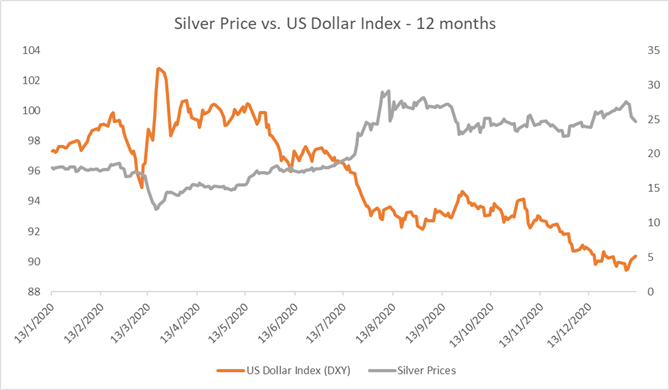
Source: Bloomberg, DailyFX
Last week, the world’s largest gold ETF - SPDR Gold Trust (GLD) – saw net capital inflow for the first time in nearly three months. The number of GLD shares outstanding has increased to 405.1 million for the week ending January 8th 2021 from a recent low of 401.2 million observed on December 31st. This reflects a slight pickup in demand for gold among ETF investors. Gold prices and the number of outstanding GLD shares have exhibited a strong positive correlation of 0.95 over the past 12 months (chart below).
Gold Price vs. GLD ETF Shares Outstanding – 12 Months
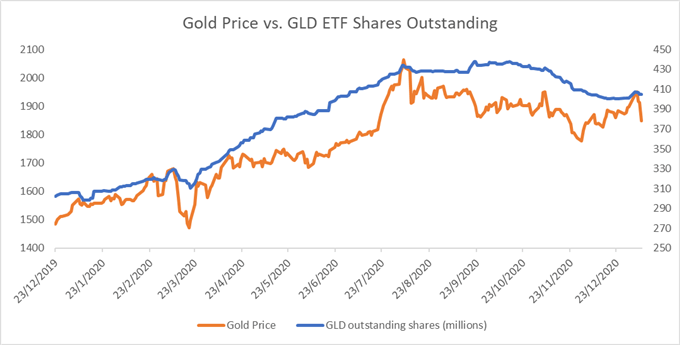
Source: Bloomberg, DailyFX
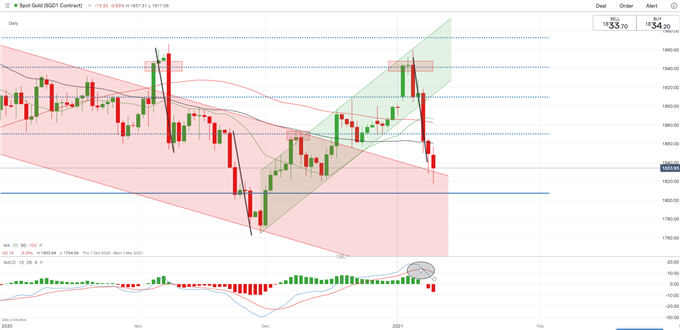
Technically, gold prices decisively plummeted below “Ascending Channel” with strong downward momentum (chart below). The MACD indicator has formed a “Death Cross”, suggesting that near-term momentum has turned bearish. A key support level could be found at US$ 1,807, breaking which may open the door for further losses with an eye on US$ 1,770 – the previous low.
Gold Price – Daily Chart
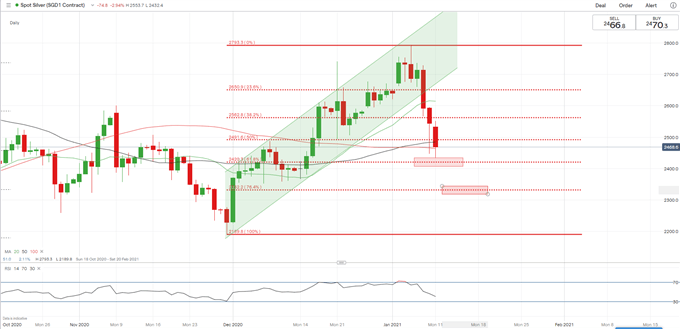
Similar to gold, silver prices broke an “Ascending Channel” channel last week and thus entered a consolidative period. Fibonacci retracement suggests that an immediate support level can be found at US$ 24.20 – the 61.8% retracement. Breaking below US$ 24.2 may open the room for further losses with an eye on US$ 23.30 and then US$ 21.90 – the previous low.
Silver Price – Daily Chart
| Change in | Longs | Shorts | OI |
| Daily | -9% | 10% | 0% |
| Weekly | 15% | -16% | -3% |
IG Client Sentiment indicates that retail gold traders are leaning heavily towards the long side, with 86% of positions net long, while 14% are net short. Traders have increased short (+14%) positions substantially while reducing long (-1%) exposure overnight. Compared to a week ago, traders have slashed short (-30%) bets while adding long exposure (+6%).
--- Written by Margaret Yang, Strategist for DailyFX.com
To contact Margaret, use the Comments section below or @margaretyjy on Twitter


