


GOLD, COPPER PRICE OUTLOOK:
- Gold prices fell from 8-week highs as the US Dollar index rebounds
- The two Georgia runoff races are very close, creating uncertainty that markets tend to dislike
- A string of strong manufacturing PMI readings and demand from China may underpin copper prices
Gold prices erased earlier gains and fell from 8-week highs as the Georgia Senate runoffs ran into tight races in Asia-Pacific mid-day trading. Similarly, copper prices suffered a minor pullback after hitting a 7-year high on Tuesday, backed by stronger US ISM Manufacturing PMI readings and solid demand from China.
The US Dollar index rebounded from a two-and-half year low as Democratic leads in the two races initially narrowed, dampening the prospect for a Democratic sweep that may enact President-elect Joe Biden’s legislative priorities including fiscal and infrastructure spending. Uncertainties surrounding the runoff election results created much uncertainty that markets tend to dislike, resulting in a broad ‘risk-off’ sentiment and heightened volatility.
In the medium term, however, election results may again prove to be a short-term catalyst for precious and base metal prices amid a cyclical recovery in global demand into 2021. This may underpin a medium- to long-term rally in base metal prices, including copper, nickel and iron ore. Purchasing managers indexes showed continues expansion in world’s largest economies including the US, EU, China and the most part of the ASEAN (Association of Southeast Asian Nations) as shown in the chart below. The US ISM Manufacturing reading came in at 60.7 versus forecast of 56.6, marking its highest reading seen since August 2018.

Base metal prices are very sensitive to the movement of the US Dollar, with copper, nickel and iron ores tending to move in opposite to the Greenback. Similar to gold, copper prices and the DXY US Dollar Index historically exhibit a negative relationship, with a correlation coefficient of -0.95 over the past 12 months (chart below). The commodity-linked Australian Dollar has shown strong positive correlation with metal and mineral fuel prices as they account for a large portion of Australia’s total exports.
CME Copper vs. DXY US Dollar Index – 12 Months
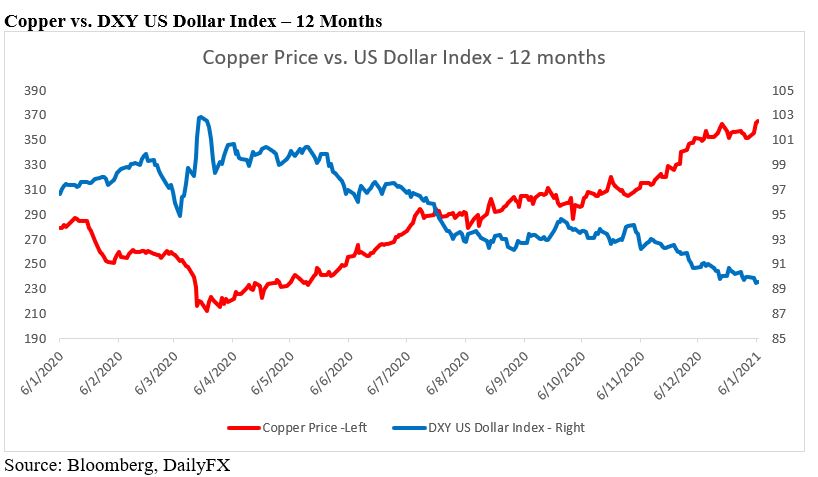
Source: Bloomberg, DailyFX

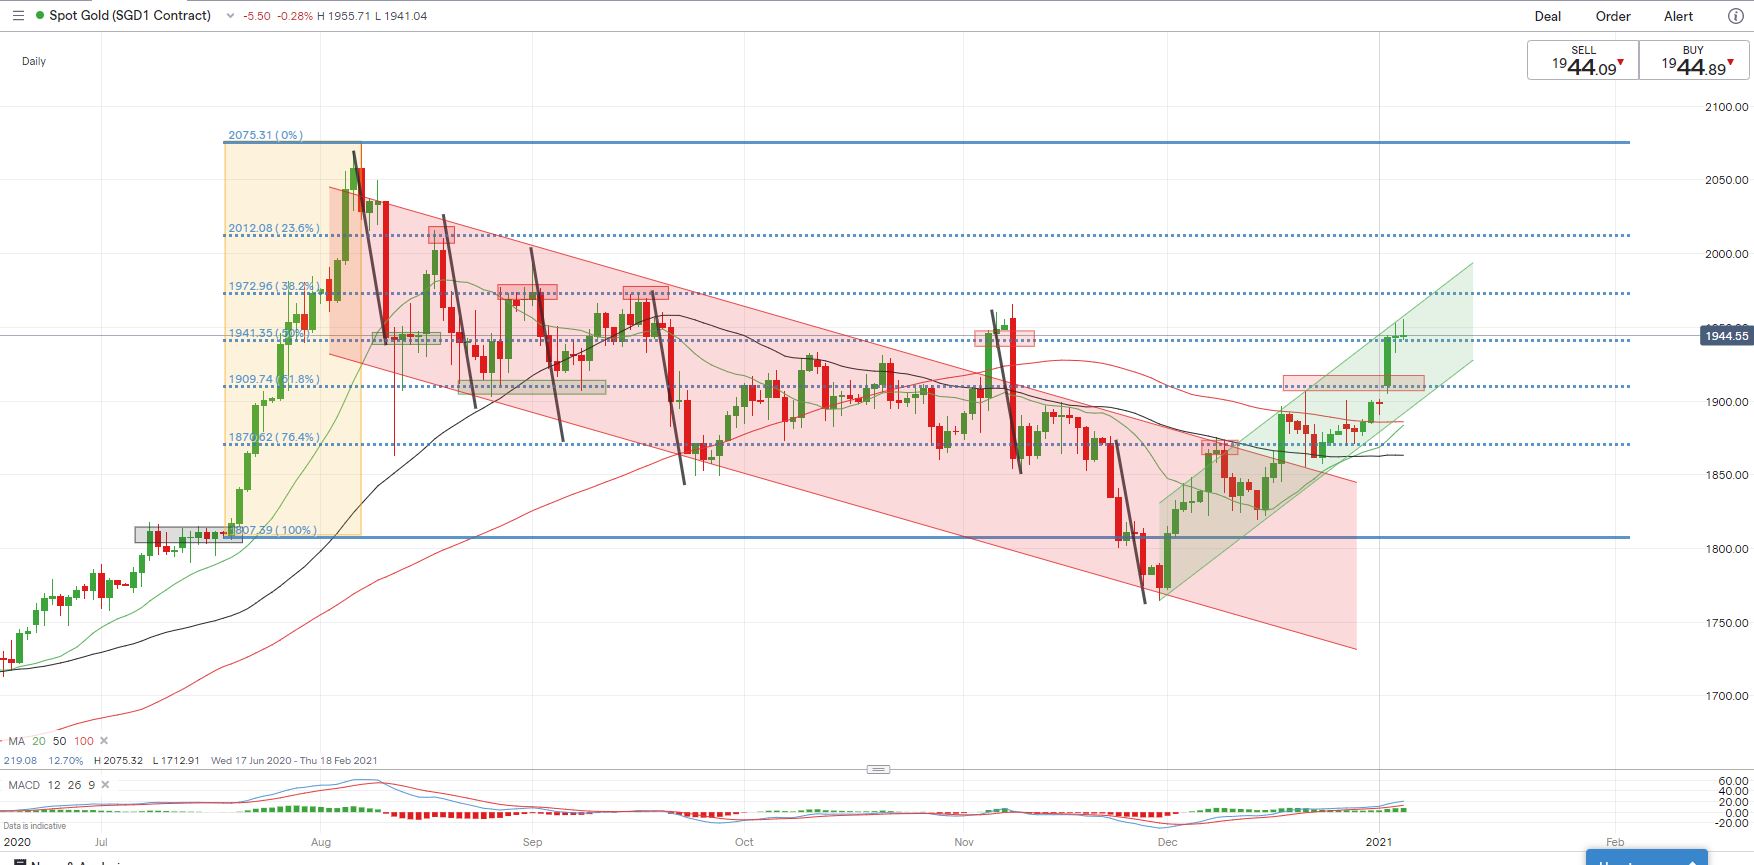
Gold prices have likely broken above a “Descending Channel” and entered into a bullish channel (chart below). Prices have formed consecutive higher highs and lows in December– an encouraging pattern that points to a potential medium-term trend reversal. Piercing through a key chart resistance of US$ 1,910 (the 61.8% Fibonacci retracement) this week has likely opened the door for further upside potential with an eye on US$ 1,940 (50% Fibonacci retracement) and then US$ 1,973 (38.2% retracement).
Gold Price – Daily Chart
The LME copper prices appear to be riding an ascending trend with the 20-, 50- and 100-Day Simple Moving Averaeg (SMA) lines lining up higher. Prices are hitting the uppper Bollinger Band and thus are susceptible to a technical correction. A firm break above the immediate 76.4% Fibonacci exension at 7,955 may open the room for further upside potential with an eye on 8,488 (100% extension). A pullback from here may lead to a test of 7,839 (20-Day SMA) for support.
Copper Price – Daily Chart

Chart by IG

--- Written by Margaret Yang, Strategist for DailyFX.com
To contact Margaret, use the Comments section below or @margaretyjy on Twitter


