


Natural Gas Talking Points
- Natural gas prices bounce back from a bearish December performance
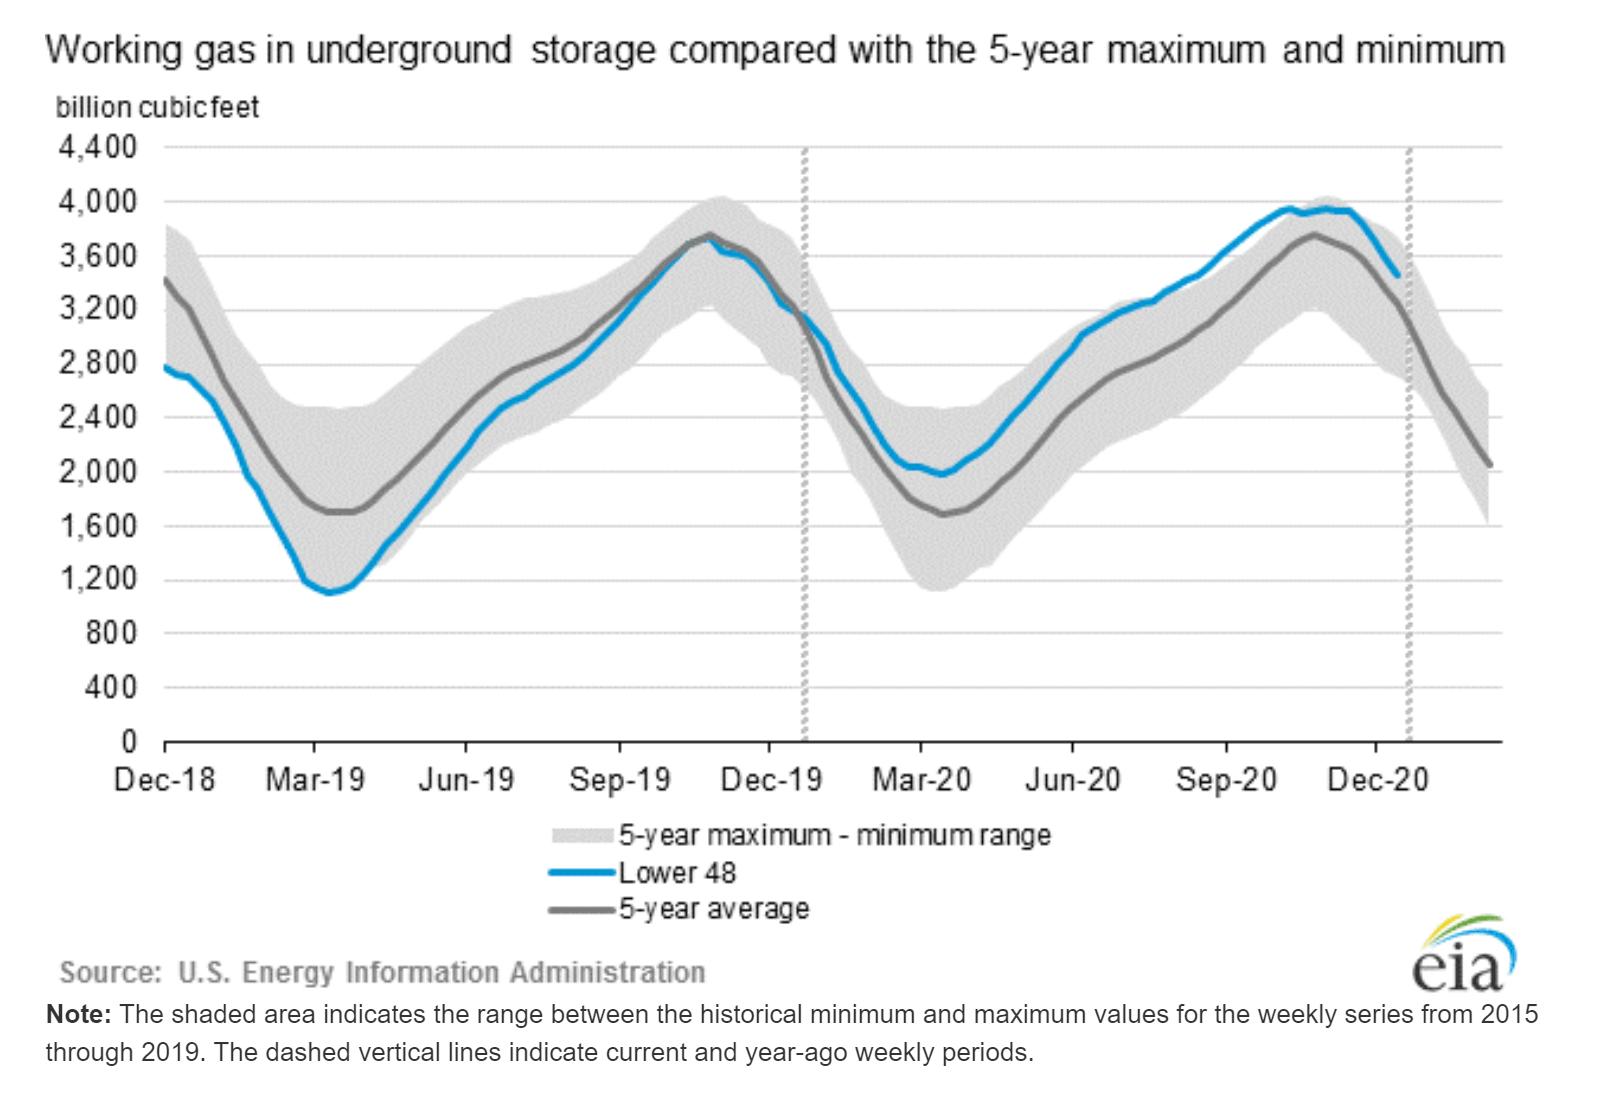
- EIA inventory storage levels improve, but still above 5-year average
- Prices gyrate at the 100-day Simple Moving Average and 50% Fib level

Natural gas prices moved higher on a bullish weather forecast for the United States, with the latest NOAA 8-14 day temperature outlook showing colder than expected temperatures likely across the Southeastern United States. The price of liquefied natural gas broke above the 2.60 handle this week as markets priced in the colder weather.
NOAA 8-14 Day Outlook Temperature Probability

Source: NOAA
Source: EIA.GOV
The colder weather is a welcome surprise for natural gas bulls, with prices recently down over 30% from the 2020 high. Prices have suffered over the past several months as warmer temperatures across the United States deflated demand for the heating gas. However, the NOAA outlook also shows warmer than expected conditions from the Western United States, extending through the Upper Midwest and Northeast regions.
The latest Weekly Natural Gas Storage Report from the EIA for the week ending December 25 shows working gas storage at 3,460 billion cubic feet (Bcf). The updated inventory level represented a 114 Bcf drop from the prior week, with the 5-year average at 3,254. While the move lower is a bullish tailwind for prices, the historically above-average storage level leaves prices more susceptible to demand-side factors.
Source: EIA
Natural Gas Technical Forecast:
The recent bounce has extended a move higher from mid-December, with bulls aiming to take out the 100-day Simple Moving Average at 2.616. Buyers may try to capitalize on the current technical posture. The MACD line recently crossed above its signal line, a bullish sign.
The current price sits near the 50% Fibonacci retracement of the October-December bearish move. A break lower may see prior trendline resistance come into play to become support. Otherwise, the 61.8% Fib would serve as the next downside target. Below that traders would eye June’s trendline to potentially stop any bleeding. Conversely, the 38.2% Fib level is a likely upside target.
Natural Gas Daily Price Chart

Chart created with TradingView
Natural Gas TRADING RESOURCES
- Just getting started? See our beginners’ guide for FX traders
- What is your trading personality? Take our quiz to find out
- Join a free webinar and have your trading questions answered

--- Written by Thomas Westwater, Analyst for DailyFX.com
To contact Thomas, use the comments section below or @FxWestwater on Twitter


