


Australian Dollar, AUD/USD, AUD/JPY, Iron Ore, Coronavirus Restrictions – Talking Points:
- Surging iron ore prices and Australia’s success in suppressing the novel coronavirus may underpin the cyclically-sensitive currency against its major counterparts.
- AUD/USD eyeing a push to multi-year highs as the RSI creeps towards overbought territory.
- Bullish moving average stacking suggests AUD/JPY may extend its recent topside push.

Iron Ore Prices, Covid-19 Suppression to Underpin AUD
The cyclically-sensitive Australian dollar seems poised to outperform its major counterparts in 2021, as the island nation keeps the novel coronavirus at bay and continues to benefit from strong demand for its most valuable export, iron ore.
Although a fresh outbreak of Covid-19 in New South Wales and Victoria has forced interstate borders to shut down, case numbers are nowhere near the levels that forced Victorian Premier Dan Andrews to enforce one of the world’s harshest lockdowns in September of last year.
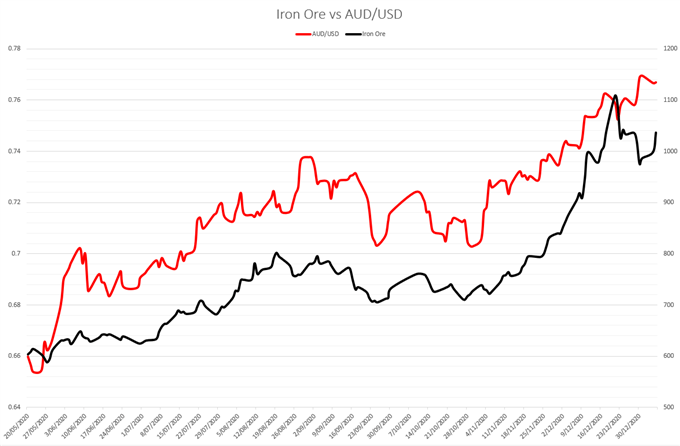
Data Source – Bloomberg
The implementation of robust contact tracing schemes in the nation's two most-populous states has permitted venues to remain open, with mandatory mask-wearing and reduced capacities in indoor settings the only notable adjustments in social distancing measures. This will likely allow the Australia to continue its economic recovery relatively unabated.
Moreover, surging iron ore prices may also underpin the trade-sensitive currency in the medium term, as Chinese demand remains elevated and the metallic rock continues to hover above the psychologically imposing $1,000 mark.
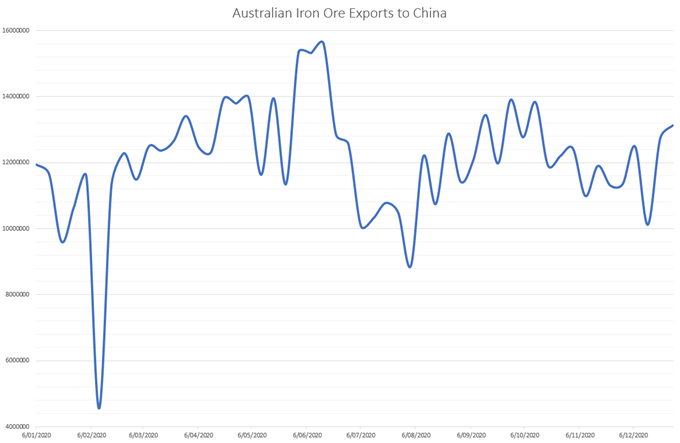
Data Source – Bloomberg
AUD/USD Daily Chart – Eyeing Resistance at 0.7800
The technical outlook for AUD/USD rates continues to favour the upside, as price tracks firmly above all 6 moving averages and remains constructively perched above psychological support at 0.7600.
With the RSI eyeing a push back above 70 and the MACD indicator travelling at its highest levels since July, the path of least resistance seems higher.
With that in mind, a retest of the 2020 high (0.7742) looks likely if support at the December 17 high (0.7640) holds firm, with a daily close above needed to bring the 127.2% Fibonacci expansion (0.7801) into focus.
Alternatively, sliding back below the 8-day exponential moving average may trigger a pullback to confluent support at the Pitchfork median line and 78.6% Fibonacci (0.7573).
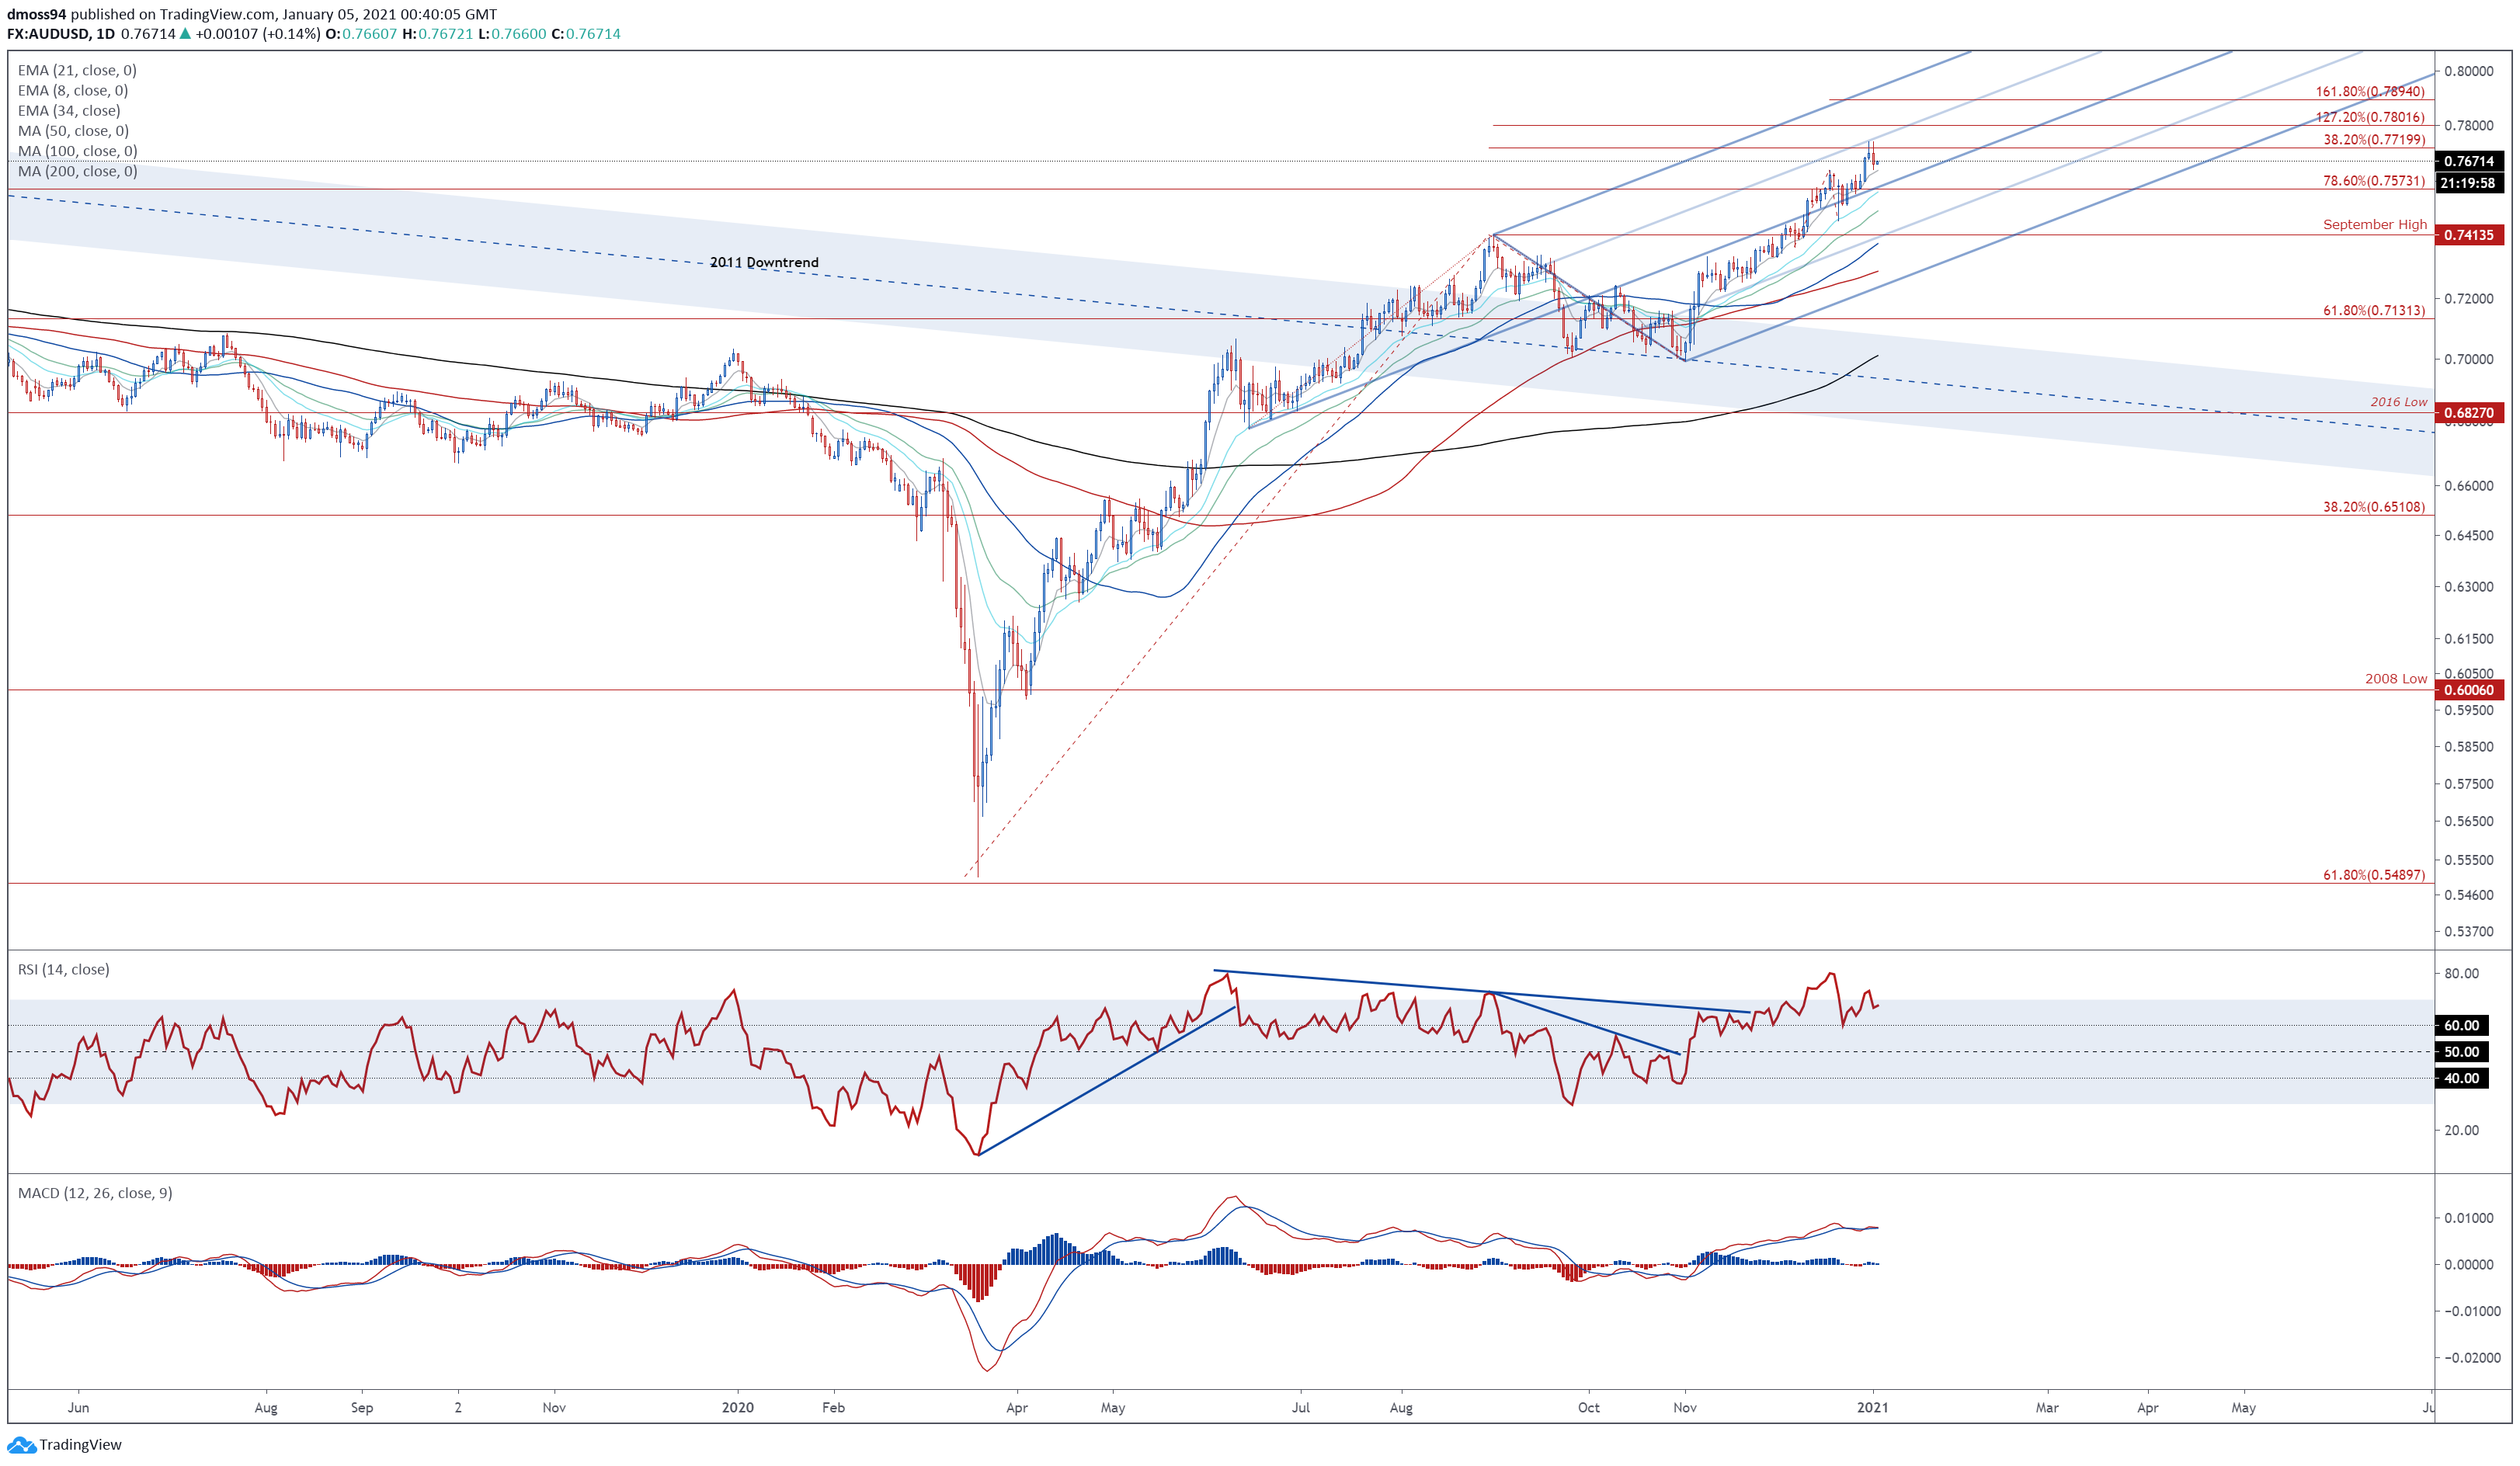
AUD/USD daily chart created using Tradingview
IG Client Sentiment Report
The IG Client Sentiment Report shows 37.70% of traders are net-long with the ratio of traders short to long at 1.65 to 1. The number of traders net-long is 25.39% higher than yesterday and 3.75% lower from last week, while the number of traders net-short is 7.27% lower than yesterday and 2.50% higher from last week.
We typically take a contrarian view to crowd sentiment, and the fact traders are net-short suggests AUD/USD prices may continue to rise.
Positioning is less net-short than yesterday but more net-short from last week. The combination of current sentiment and recent changes gives us a further mixed AUD/USD trading bias.

AUD/JPY Daily Chart – 2019 High Coming Into the Crosshairs
AUD/JPY rates also look poised to extend their recent topside push, as price bursts through the psychologically imposing 79.00 mark.
With the MACD indicator and the RSI tracking firmly above their respective neutral midpoints, the path of least resistance seems to favour the upside.
A daily close above the 38.2% Fibonacci (79.17) would probably precipitate a test of the December 31 high (79.79), with a break above clearing a path for buyers to probe the 2019 high (80.72).
Conversely, falling back below 79.00 may neutralize near-term buying pressure and generate a short term pullback towards confluent support at the August high (78.46) and the 21-day EMA.

AUD/JPY daily chart created using Tradingview
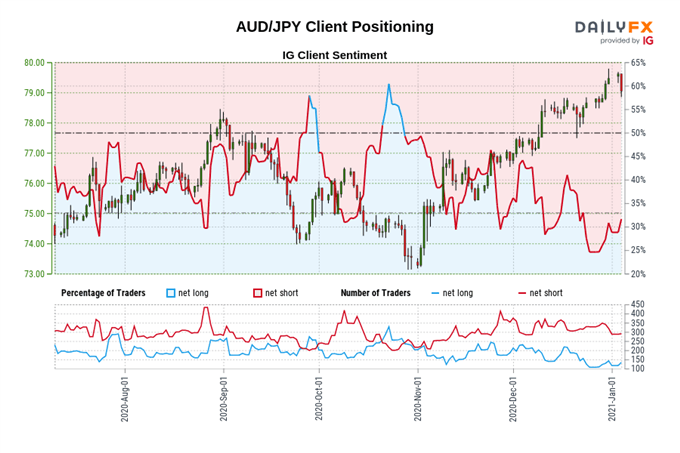
IG Client Sentiment Report
Retail trader data shows 34.89% of traders are net-long with the ratio of traders short to long at 1.87 to 1. The number of traders net-long is 22.41% higher than yesterday and 23.48% higher from last week, while the number of traders net-short is 7.67% lower than yesterday and 22.97% lower from last week.
We typically take a contrarian view to crowd sentiment, and the fact traders are net-short suggests AUD/JPY prices may continue to rise.
Yet traders are less net-short than yesterday and compared with last week. Recent changes in sentiment warn that the current AUD/JPY price trend may soon reverse lower despite the fact traders remain net-short.
-- Written by Daniel Moss, Analyst for DailyFX
Follow me on Twitter @DanielGMoss


