


Chinese Industrial Profits, AUD/USD, Iron Ore, Copper – Talking Points
- Copper, iron prices may rise as Chinese industrial profits record seventh month of gains
- AUD/USD prices climb above trendline resistance as rising iron prices boost sentiment
- Copper nears 8,000 as Chinese economy outlook forecast strong continued demand
Iron ore and copper prices are trading higher this week following China’s National Bureau of Statistics reporting a seventh consecutive month of growth in industrial profits. Industrial firms continued to see increased profits in November, with the DailyFX Economic Calendar showing a 2.4% increase on a YoY year-to-date basis, up from 0.7% in October. Meanwhile, AUD/USD is trading above the 0.76 handle as prices climb above resistance.
AUD/USD, Iron Ore, Copper – Daily Chart
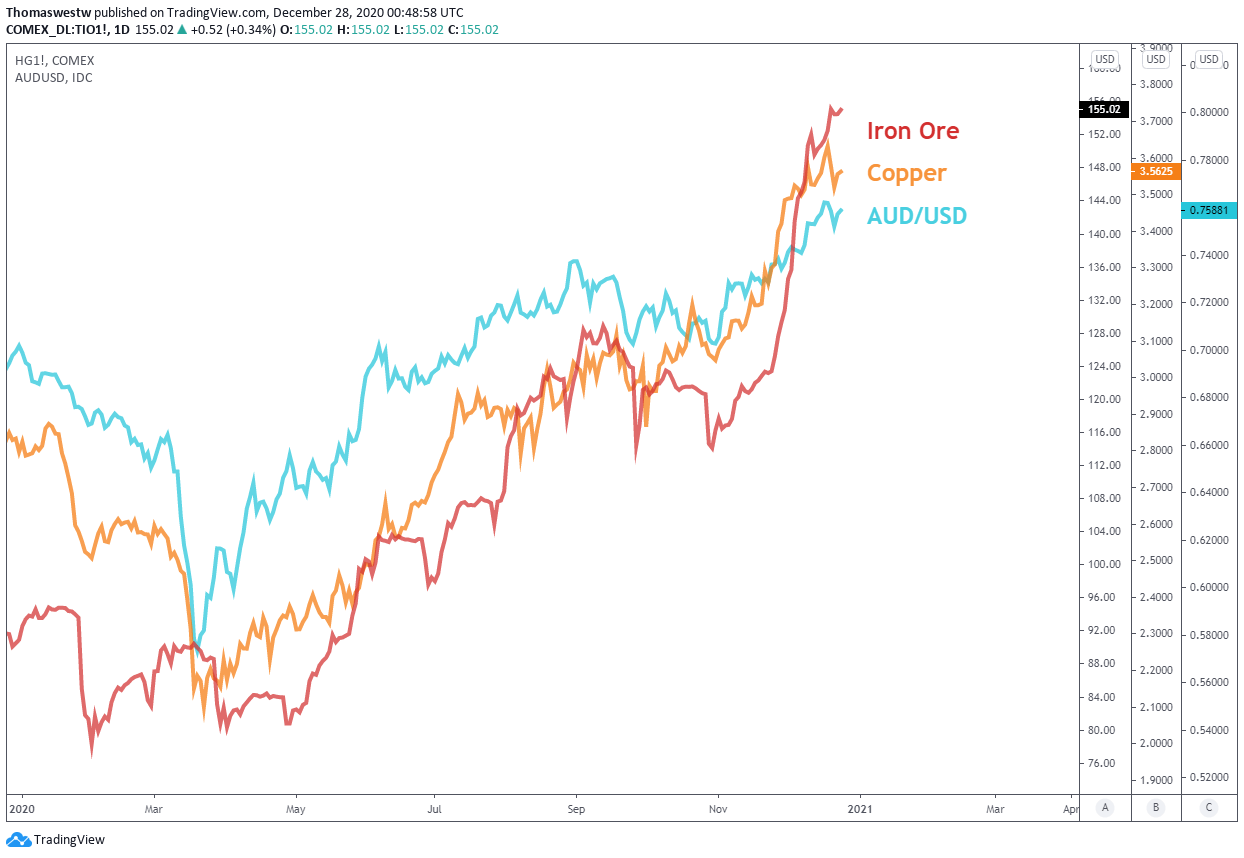
Chart created with TradingView
China’s strong rebound from the coronavirus pandemic has pushed iron and copper prices to fresh multi-year highs this year. According to the latest economic projections from the IMF, China is slated to be the only major economy to avoid contracting in 2020. The Australian Dollar has been a primary beneficiary of the recovery, with iron ore’s rising prices driven largely by Chinese demand helping to boost confidence in Australia’s economy.
Chinese GDP Chart

Chart prepared by Brendan Fagan

Despite being the original epicenter for the pandemic, the Chinese economy rebounded swiftly, growing by 3.2% in Q2 and 4.9% in Q3, respectively. Moreover, Fitch ratings upped its 2021 Chinese GDP forecast from 7.7% to 8.0% earlier this month, further strengthening the upbeat global outlook on future Chinese growth. Traders will key in on PMI data this Thursday with analysts’ expectations at 52.2 for NBS Manufacturing PMI. Better than expected Chinese economic data is likely to spur growth in the industrial metals space, particularly iron ore and copper prices.
China Economic Calendar – Events To Watch In The Week Ahead
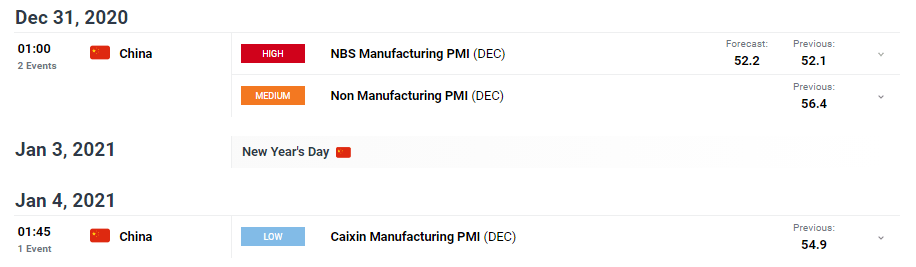
Source: The DailyFX Economic Calendar
AUD/USD is now trading within 0.50% of its 2020 high after prices rose above trendline resistance to start the week. The move higher may be subject to a pullback, however, if broader market sentiment breaks down. The RSI oscillator is looking to break above the 70 overbought level, and the MACD recently crossed below its signal line, a bearish momentum signal. The path higher may persist, but the overall technical structure remains fragile, and a pullback is certainly not off the table.
AUD/USD Daily Chart

Chart created with TradingView
AUD/USD TRADING RESOURCES
- Just getting started? See our beginners’ guide for FX traders
- What is your trading personality? Take our quiz to find out
- Join a free webinar and have your trading questions answered
--- Written by Thomas Westwater, Analyst and Brendan Fagan, Contributor for DailyFX.com
To contact Thomas, use the comments section below or @FxWestwater on Twitter


