


Natural Gas Analysis:
- EIA weekly natural gas storage figures estimated to reflect a further drop in storage
- Lower storage figures often signal an increase in demand and may push prices higher despite overbought conditions
- Technical landscape and key levels provided
EIA Weekly Natural Gas Storage Report Preview (23 December)
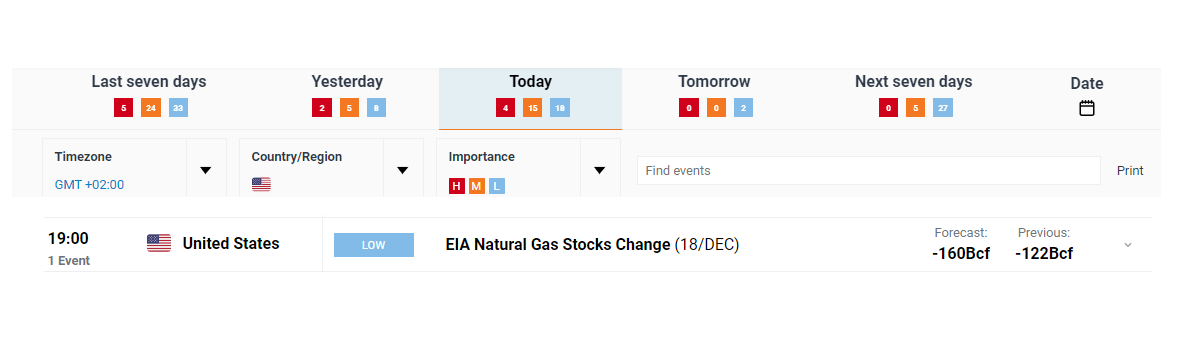
The US energy information agency (EIA) is set to release the weekly natural gas storage one day ahead of schedule to account for the holidays. Estimates suggest another negative change in storage (drawing on existing stock), suggesting an increase in demand for the commodity.
Forecast = -160 Bcf change.
Additionally, a recent update from the National Oceanic and Atmospheric Administration (NOAA) suggests that the south western regions of the US appear likely to experience colder than average temperatures over the Christmas/New Year crossover.
Economic release: EIA
For all market-moving data releases and events see the DailyFX Economic Calendar
Previous EIA Report
The December 17 report for the week ending 11 December, reported a decline in underground storage of 122 billion cubic feet (bcf) but still remained above the 5-year average.
EIA Report (December 17):
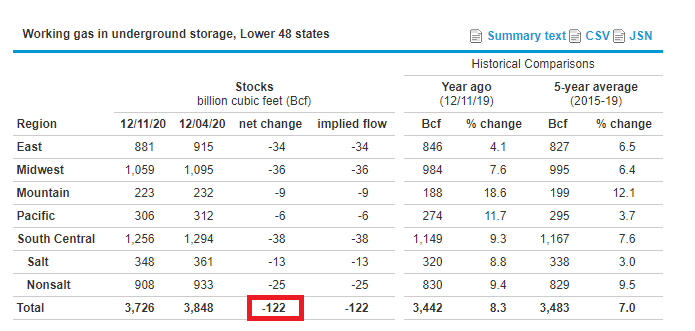
Source: EIA

Technical Landscape Ahead of EIA Storage Report
After reaching the swing high around 3406, nat gas has printed a series of lower lows and lower highs, consistent with a down trend. That is until yesterday when nat gas broke above the descending trendline and area of recent consolidation (yellow rectangle) where it remains - at the time of writing - although, at lower levels than yesterday.
Colder than average temperatures forecast for parts of the US and lower storage figures may present a bullish narrative for natural gas. Should this be the case, bulls may anticipate a short-term retracement towards trendline support before attempting a move higher. A move higher would see the first level of resistance at the 23.6% Fib (drawn from June low to the October high) at 2960. A much larger move would then bring into play the 3130 and 3406 levels.
Alternatively, should price fail to remain above the descending trendline, a move to the downside is possible. The stochastic oscillator currently places natural gas in overbought territory but has not yet crossed below the 80 level – which traders use to gauge a potential bearish move. Current support remains the descending trendline while a break below brings the 2380 and 61.8% Fib level (2240) into focus.
Daily Nat Gas Price Chart (Cash)
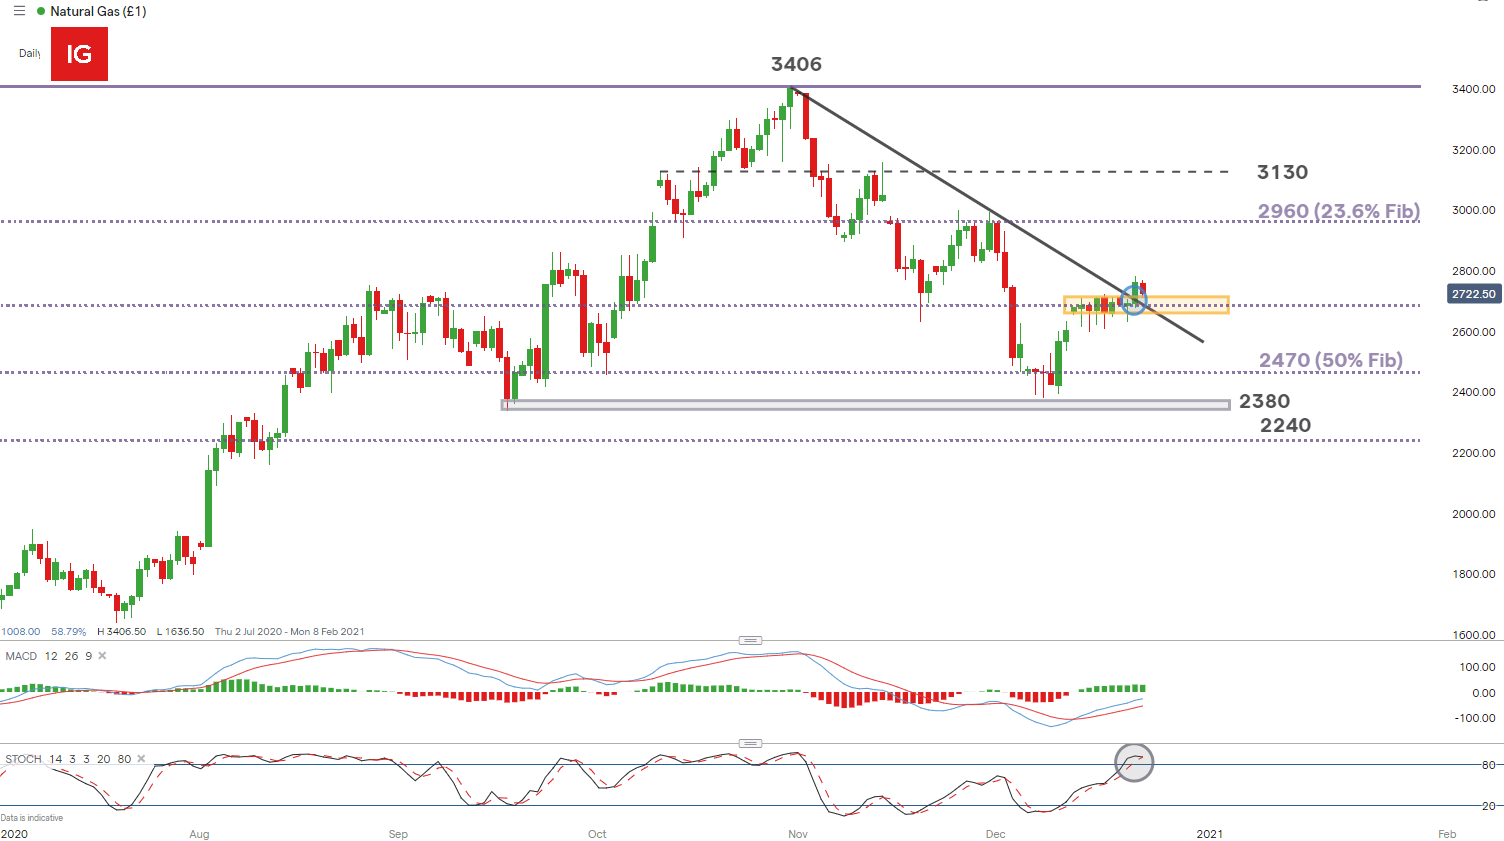
Chart prepared by Richard Snow, IG

--- Written by Richard Snow for DailyFX.com
Contact and follow Richard on Twitter: @RichardSnowFX


