Natural Gas Prices, Weather Outlook, Technical setup – Talking Points
- Natural Gas prices move higher on colder weather outlook
- EIA inventory levels remain elevated vs. five-year average
- Technical outlook looks bullish, but scope for gains capped
Natural gas prices are seeing a bullish start to the week as colder weather is expected across the southwest United States over the next two weeks. A larger draw in inventories last week is likely adding some fuel to the upward movement as well. The technical picture appears bullish in the short run, but the path higher sees resistance on the horizon.
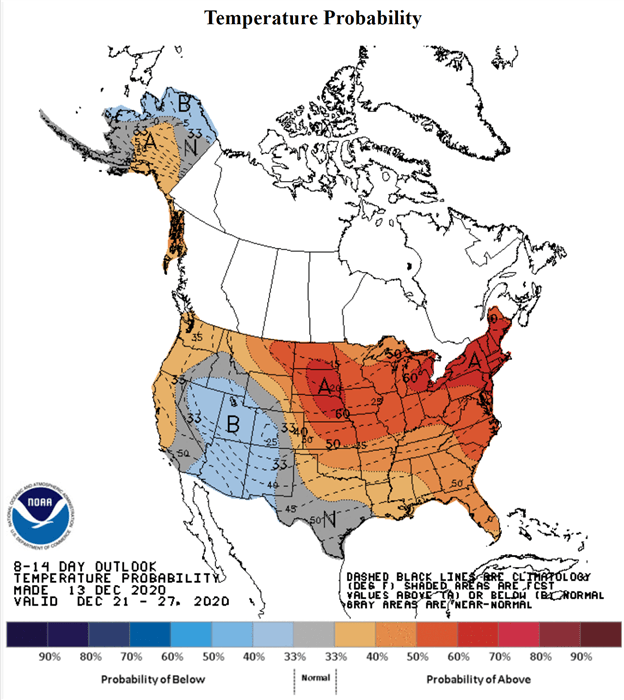
The most recent NOAA 8-14 day Temperature Probability Outlook from December 13 sees below-average temperatures blanketing much of the southwestern United States. This bullish forecast comes at a critical time, with heating gas down over 20% from its October 2020 high following a historically warm November across not only the United States but also Northern Europe.
NOAA 8-14 Day Outlook Temperature Probability

Source: NOAA
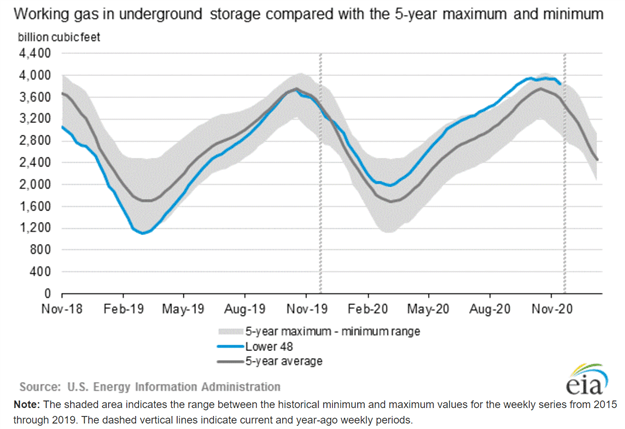
Outside of temperature forecasts, inventory levels also provided a bullish tailwind for heating gas, with the most recent EIA Weekly Natural Gas Storage Report showing a draw of 91 billion cubic feet (Bcf) for the week ending December 4. While the inventory draw lifted prices, natural gas stocks are currently 260 Bcf over the five-year average, according to EIA data.
EIA NATURAL GAS UNDERGROUND STORAGE

Source: EIA


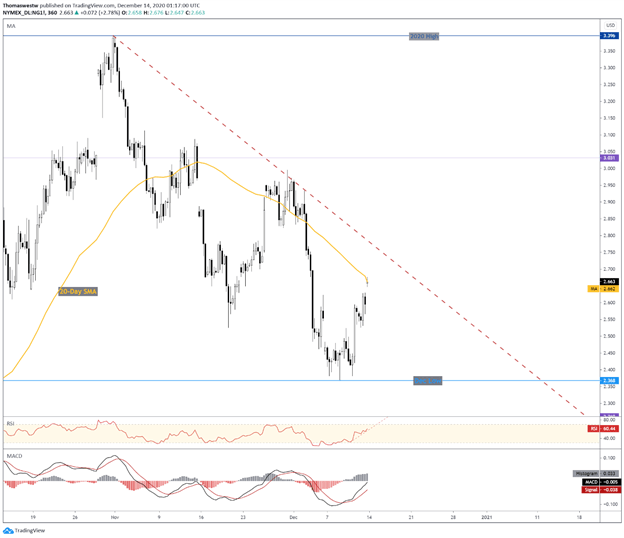
To the upside, the technical setup for natural gas appears to have room for recent momentum to carry prices higher, with the 6-hour Moving Average Convergence Divergence (MACD) on the verge of crossing above the zero line, and the Relative Strength Index (RSI) pushing higher along a supportive trendline.
However, trendline resistance will soon come into focus for natural gas bulls should prices continue higher. Meanwhile, the 20-day downward trending Simple Moving Average offers immediate resistance at 2.662. The week ahead offers weekly EIA natural gas statistics, according to the DailyFX Economic Calendar.
6-Hour Natural Gas Chart (NYMEX)

Chart created with TradingView
Natural Gas TRADING RESOURCES
- Just getting started? See our beginners’ guide for FX traders
- What is your trading personality? Take our quiz to find out
- Join a free webinar and have your trading questions answered
--- Written by Thomas Westwater, Analyst for DailyFX.com
To contact Thomas, use the comments section below or @FxWestwater on Twitter


