


USD/ZAR Price Analysis
- South African Q3 GDP Surpasses Expectations
- USD/ZAR breaks below key psychological level of 15.00
- RSI borders oversold territory
Positive Economic Data Fuels Rand Strength
Bears trading USD/ZAR have managed to gain traction after South Africa’s Q3 GDP data surpassed expectations, indicating that the economy grew by a massive annualized 66.1% (QoQ) in the third quarter, beating estimates of 57.1%. The positive figures appeared to provide a glimmer of hope for the Emerging Market (EM) currency, overshadowing concerns relating to the recent rating downgrade by credit agencies Fitch and Moody’s.
Visit the DailyFX Educational Center to discover why news events are Key to Forex Fundamental Analysis
After five consecutive weeks of gains, the formation of the Doji candle (highlighted on the weekly chart below) suggested that bears were struggling to maintain after prices fell to a key level of support, formed by the 76.4% Fibonacci retracement level at 15.198.
However, positive GDP results, optimism regarding the Coronavirus vaccine and further Dollar weakness were a few factors which contributed to an increase in the demand for the ZAR. An increase in risk sentiment once again fueled the momentum of the downtrend, driving price action below both the 100 period Simple Moving Average (SMA) and the key psychological level of 15.000, a level which hasn’t been tested since late February.

USD/ZAR Weekly Chart
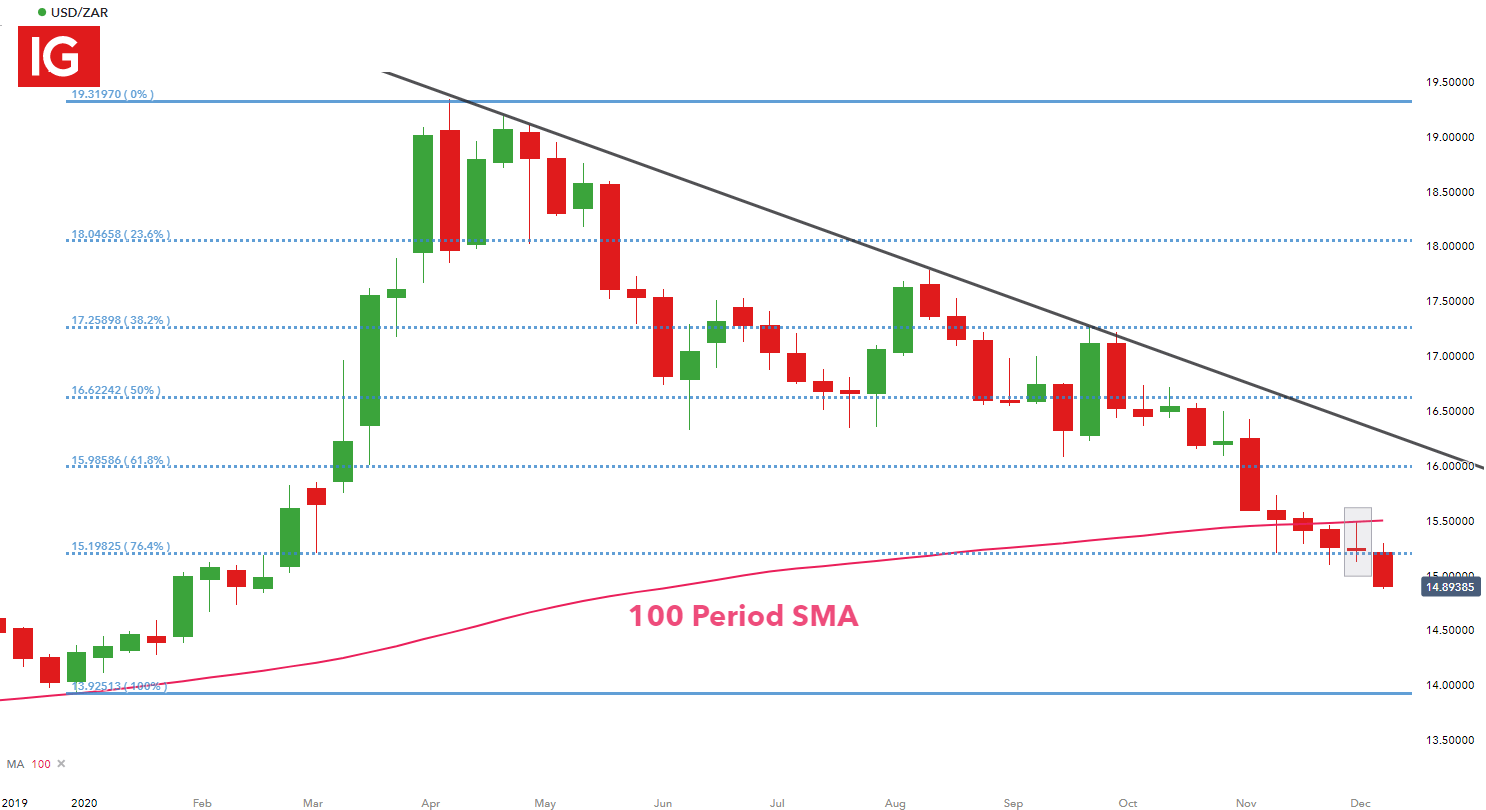
Chart prepared by Tammy Da Costa, IG
USD/ZAR Strategy Ahead
Since recovering from April highs, USD/ZAR has been on a downward trajectory represented by the declining trendline highlighted on the daily chart below. From a technical standpoint, the downward trend continues to hold for now, with the psychological level of 15.000 helping to set resistance. A break above this level could see bulls pushing price action towards the 76.4% Fibonacci level of 15.198.
In addition to this, the Relative Strength Index (RSI) is bordering 30, a possible indication that the pair may be nearing oversold territory. However, if prices continue to fall, the next zone of support could form at 14.73, a level which provided support in January 2020.

USD/ZAR Daily Chart
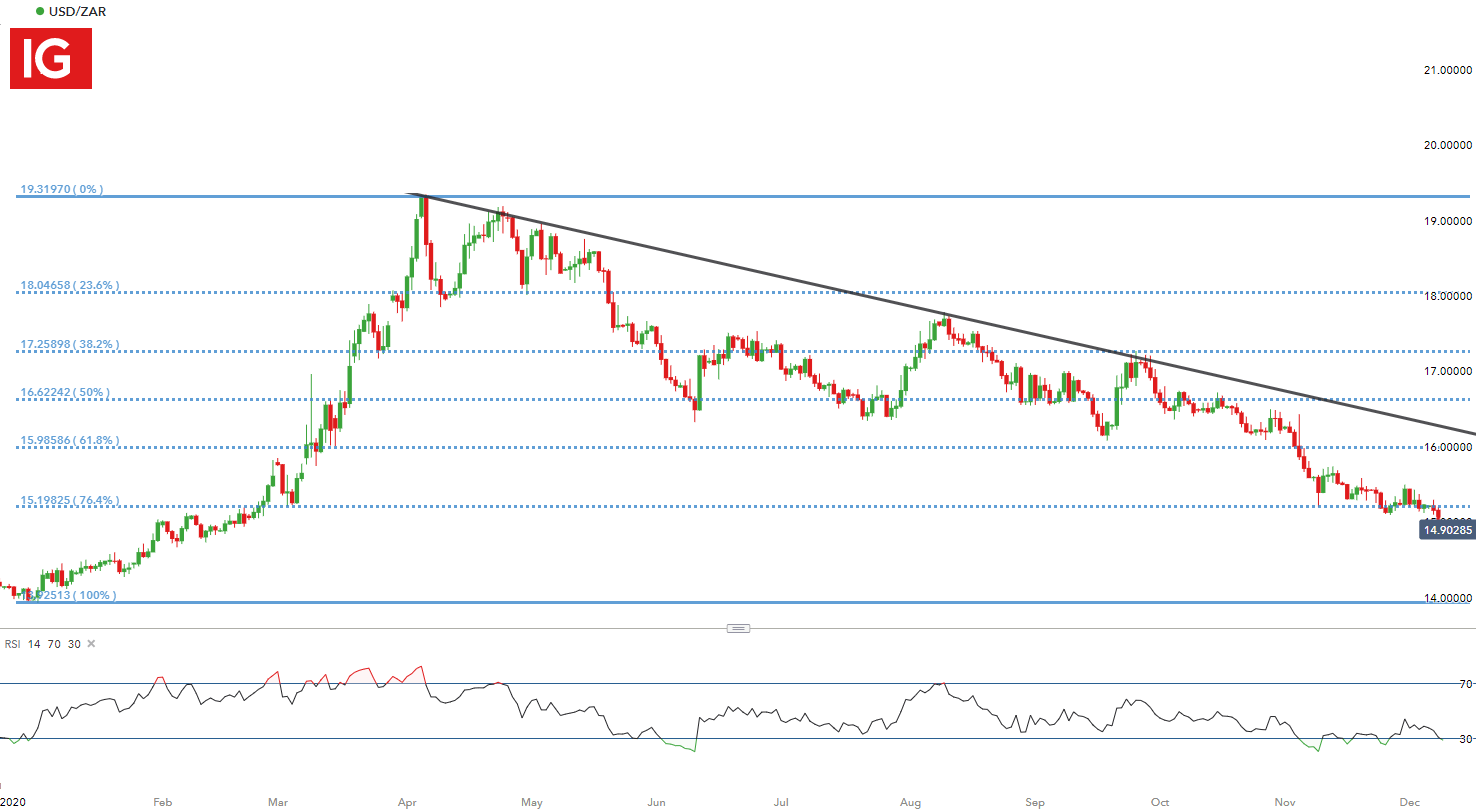
Chart prepared by Tammy Da Costa, IG
--- Written by Tammy Da Costa, Market Writer for DailyFX.com
Contact and follow Tammy on Twitter: @Tams707


