


Silver Price Outlook:
- XAG/USD remains confined to key Fibonacci Levels
- CCI Lurks in Overbought Territory
- Triangle formation may provide additional confirmation for price action
Visit the DailyFX Educational Center to discover why news events are Key to Forex Fundamental Analysis
Silver Gains Favor as a Safe-Haven Asset
After five consecutive months of gains, bulls trading XAG/USD were unable to maintain the momentum of the rally, which has persisted for much of this year. This comes after the Coronavirus pandemic wreaked havoc in the markets, resulting in an increase in the demand for Silver, Gold and other safe-haven assets.
Although the demand for Silver is largely attributed to its industrial uses, the inverse relationship between Silver and USD suggests that, much like its Gold counterpart, XAG/USD is becoming increasingly popular as both an inflationary hedge and a means of portfolio diversification, specifically during periods of economic uncertainty. With that being said, during these unprecedented times, both technical and fundamental factors may be additional drivers of price action for the foreseeable future.
XAG/USD Remains Faithful to Key Fibonacci Levels
From a technical standpoint, the monthly chart below highlights the long-term momentum of price action, with the Fibonacci retracement representing the historical price low (October 2008) and high (April 2011). Since 2014, Silver prices have been stuck in a range, between the 76.4% retracement level (1817.9) and a dominant level of support at 1417.2. However, after breaking through that key level of resistance in July 2020, bulls were able to exert dominance, pushing price action towards the 50% retracement level, just short of 3000, a key psychological level. Meanwhile, prices continue to remain well above the 55 period exponential moving average (EMA), while the Commodity Channel Index (CCI), remains around 100, suggesting that Silver may still be hovering into overbought territory.

Silver Monthly Chart
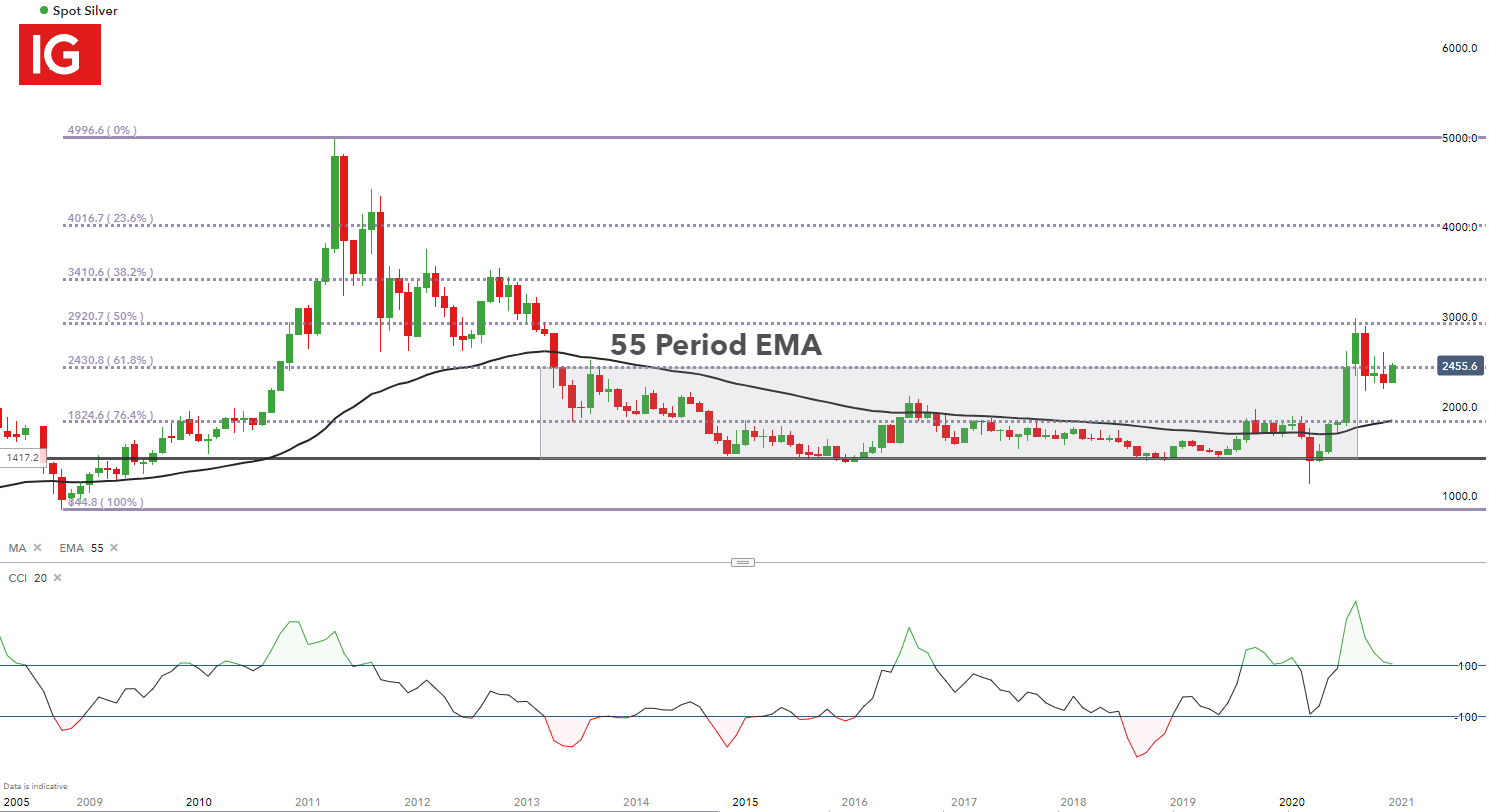
Chart prepared by Tammy Da Costa, IG
XAG/USD Forms Triangle
For those focused on short-term moves, the daily chart below now highlights the Fibonacci retracement levels from the minor move, between March 2020 low and August 2020 high. Once again, while these levels have provided key levels of support and resistance, after retracing from August highs, a relatively flat support line combined with a downward sloping trendline, suggests the possible formation of a triangle pattern, which may provide additional confirmation in the event that prices break above/below the formation.

Silver Daily Chart

Chart prepared by Tammy Da Costa, IG
Silver Strategy Moving Forward
For now, the 61.8% Fibonacci retracement of the historical move continues to hold as support at 2427, with a break below possibly bringing the 38.2% retracement level of the short-term move into play at 2277.8.
On the opposite end, the 23.6% retracement level of the short-term move holds as resistance at 2547.7, with the next level of resistance holding at the psychological level of 2600.
--- Written by Tammy Da Costa, Market Writer for DailyFX.com
Contact and follow Tammy on Twitter: @Tams707


