


Key Talking Points:
- USD/MXN hangs around the 20.00 mark gathering momentum for a new try at a sustained break below this level
- Key levels to take into account going forward
As I mentioned in my forecast for this week, USD/MXN was able to break below 20.00 but buyers were introduced at around the 19.87 area, which had been a key resistance prior to the Covid-19 outbreak. Price action has been slightly subdued this week due in part to the Thanksgiving holiday in the US, which means USD/MXN has been able to stay below the descending resistance line from the April 2020 highs.
USD/MXN Daily Chart


We’ve seen the pair show ability to break through significant levels, so a sustained break below 20.00 shouldn’t be a problem in the short-term. A lack of liquidity to end the week could provide the base case for some volatility spikes, but momentum is largely expected to continue to be lower heading into next week.
But sellers should be aware of the possibility of an upward reversal as USD/MXN attempts to reach 19.87, as the stochastic is now bordering the oversold line, and the MACD is showing to be less positive, which could be a sign that bullish pressure is building in the market.
Mexican economic data published this week has been optimistic, with third-quarter GDP rising 12.1%, 0.1% more than expected, and retail sales growing 2.7% in September, when expectations were for growth of just 2%. But currency markets have paid little attention to data in the last few weeks, as risk sentiment remains steady as they continue to follow the narrative of positive vaccine news.
USD/MXN Weekly Chart
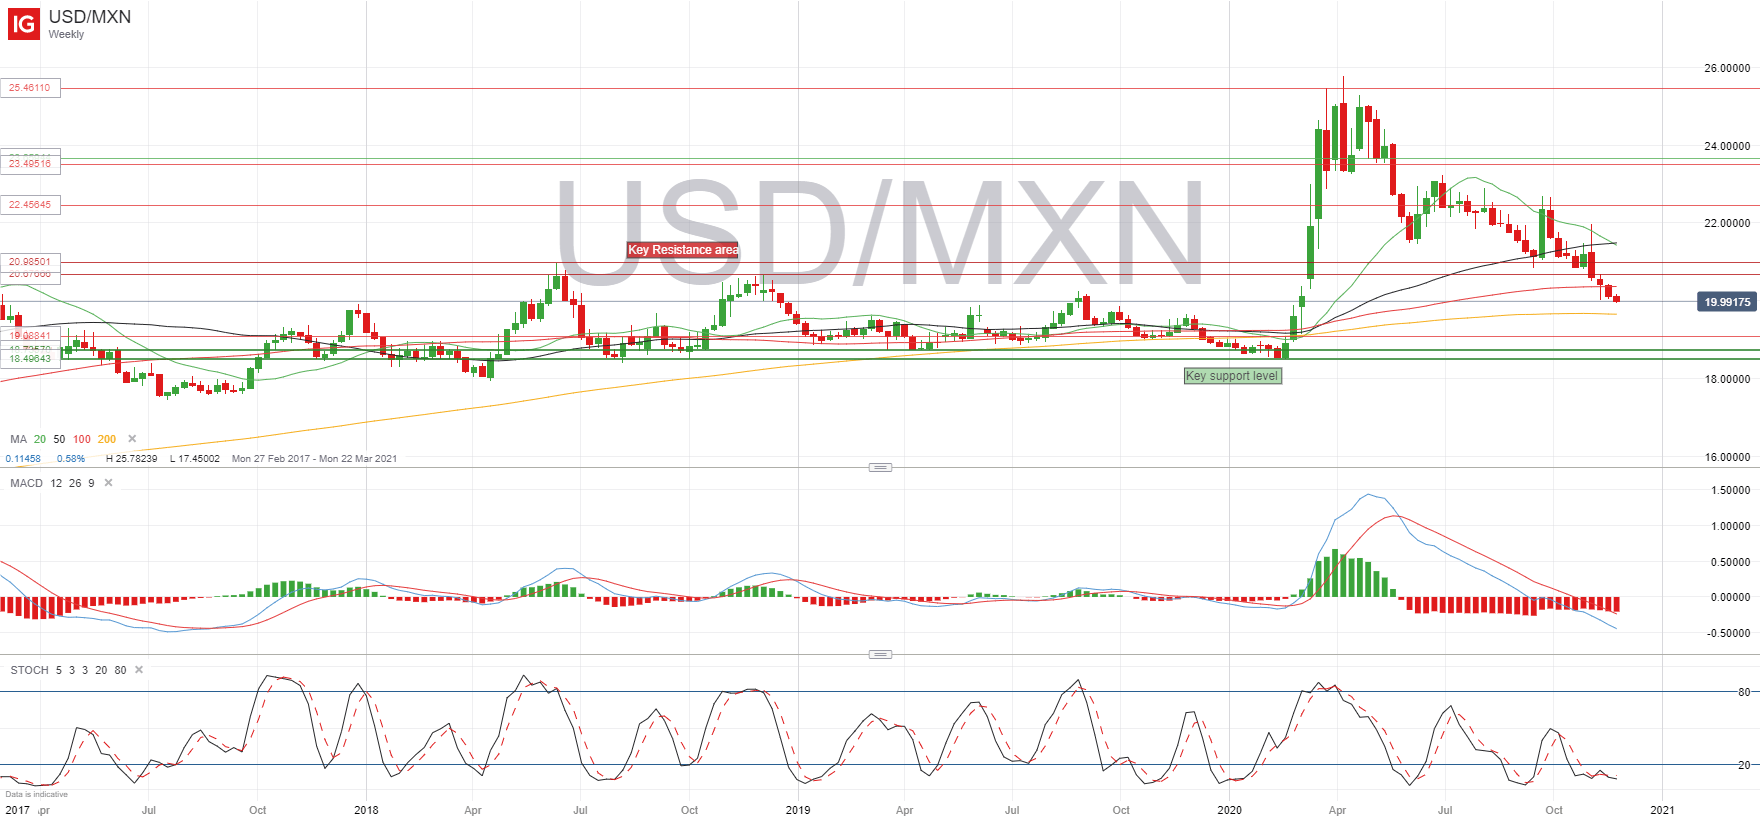
Looking at a weekly chart to have a wider view, USD/MXN is now treading known waters as this was an area widely visited back in 2018. Attempts to push higher were previously halted between 20.67 and 20.98, so this could be a key area of resistance going forward. To the downside, the 200 weekly moving average could offer some support for buyers, but we can expect the pair to continue gathering downside momentum and therefore we should focus on the area between 18.73 and 18.49 as the medium-term objective for sellers.
Momentum indicators on the weekly timeframe are showing an even more oversold picture for USD/MXN so I wouldn’t be surprised if we see a small bounce in the short-term, but this is likely to offer a better entry point for sellers, tilting momentum down to the downside again. If we look at moving averages, the 20-SMA has just started to cross under the 50-SMA, supporting this view of sustained weakness in USD/MXN.

--- Written by Daniela Sabin Hathorn, Market Analyst
Follow Daniela on Twitter @HathornSabin


