


Bitcoin (BTC/USD) and Ripple (XRP/USD) Price, Analysis and Chart:
- Bitcoin looks to extend its bullish run
- Ripple gets its volatility back.
The cryptocurrency craze is now in full-swing with altcoins following Bitcoin sharply higher. While BTC has been making steady, strong gains over the last 2-3 months, altcoins have noticeably lagged until this week when they recorded double-digit gains in active turnover. While Bitcoin remains just 2-3% off its all-time high, Ethereum (ETH) is trading at $600 compared to its January 2018 high of $1,420, Ripple is trading at $0.61 compared to its all-time high of just over $3, while Bitcoin Cash currently changes hands at $341 compared to its spike all-time high of $4,100. It may well be that a rising tide is lifting all boats for the time being.

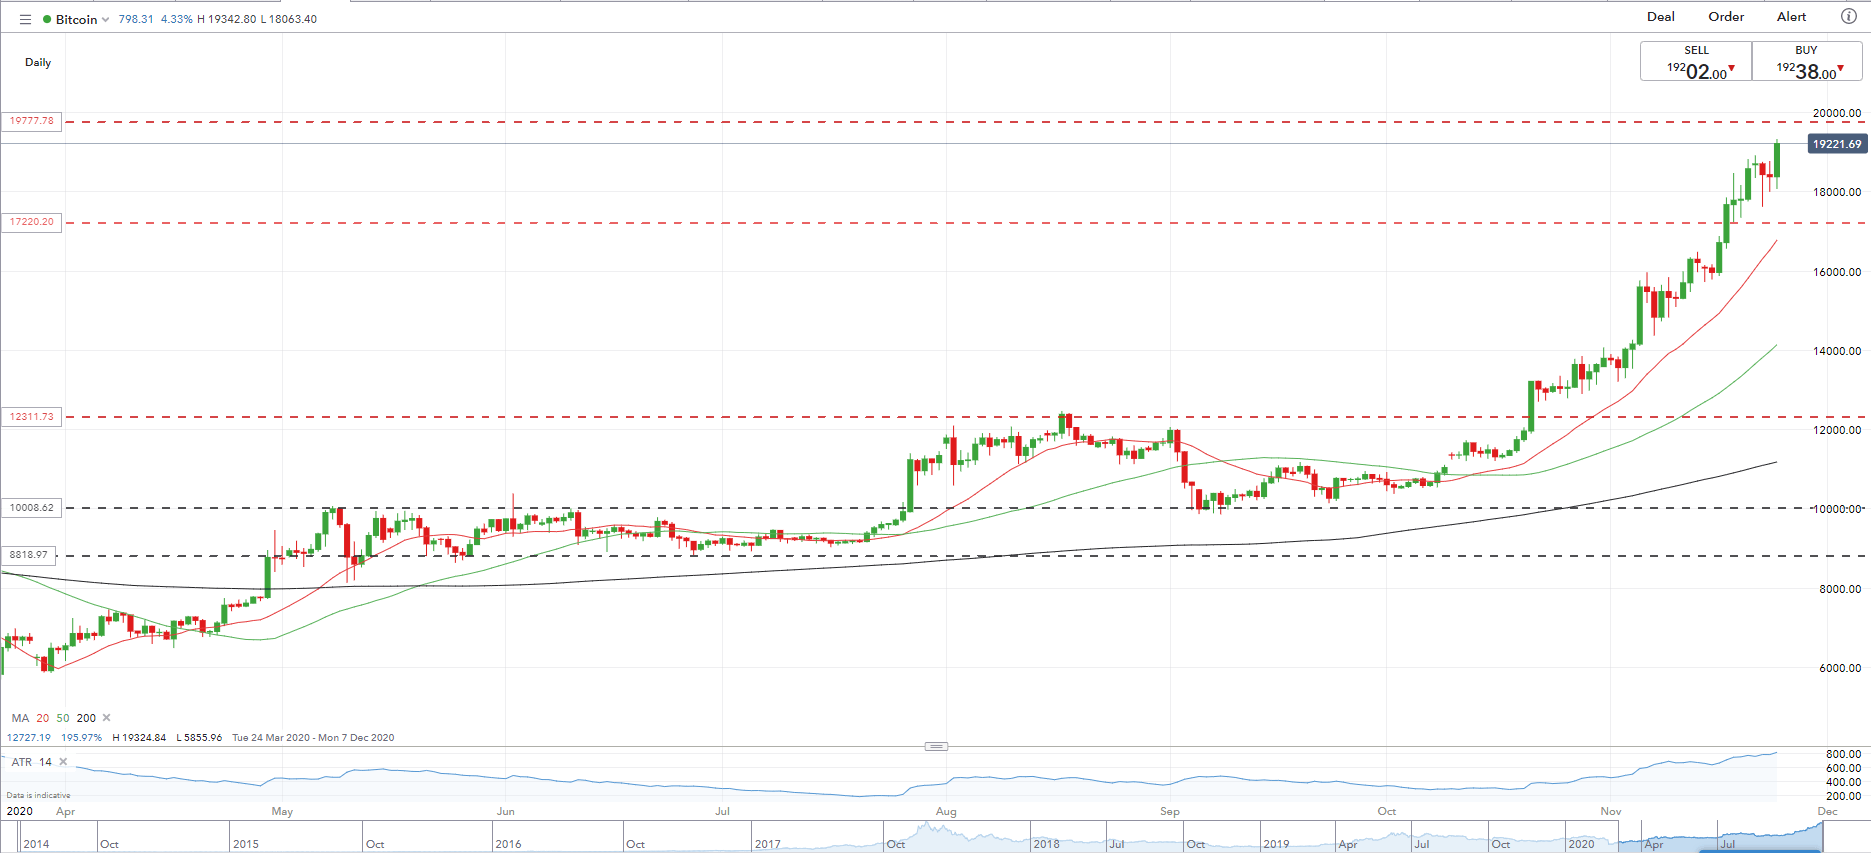
Bitcoin is now closing in on its all-time high and there is nothing on the charts that suggests that $20,000+ cannot be achieved in the short-term. While sellers may be drawn in by the ATH/big figure, the near-constant printing of higher-lows and higher-highs since the start of September remains in place, while all three moving-averages are accelerating higher. As always with any cryptocurrency, care should be taken and volatility should be monitored (using the ATR reading). Expect more ‘all-time high’ headlines ahead.
Bitcoin (BTC/USD) Daily Price Chart (March – November 24, 2020)
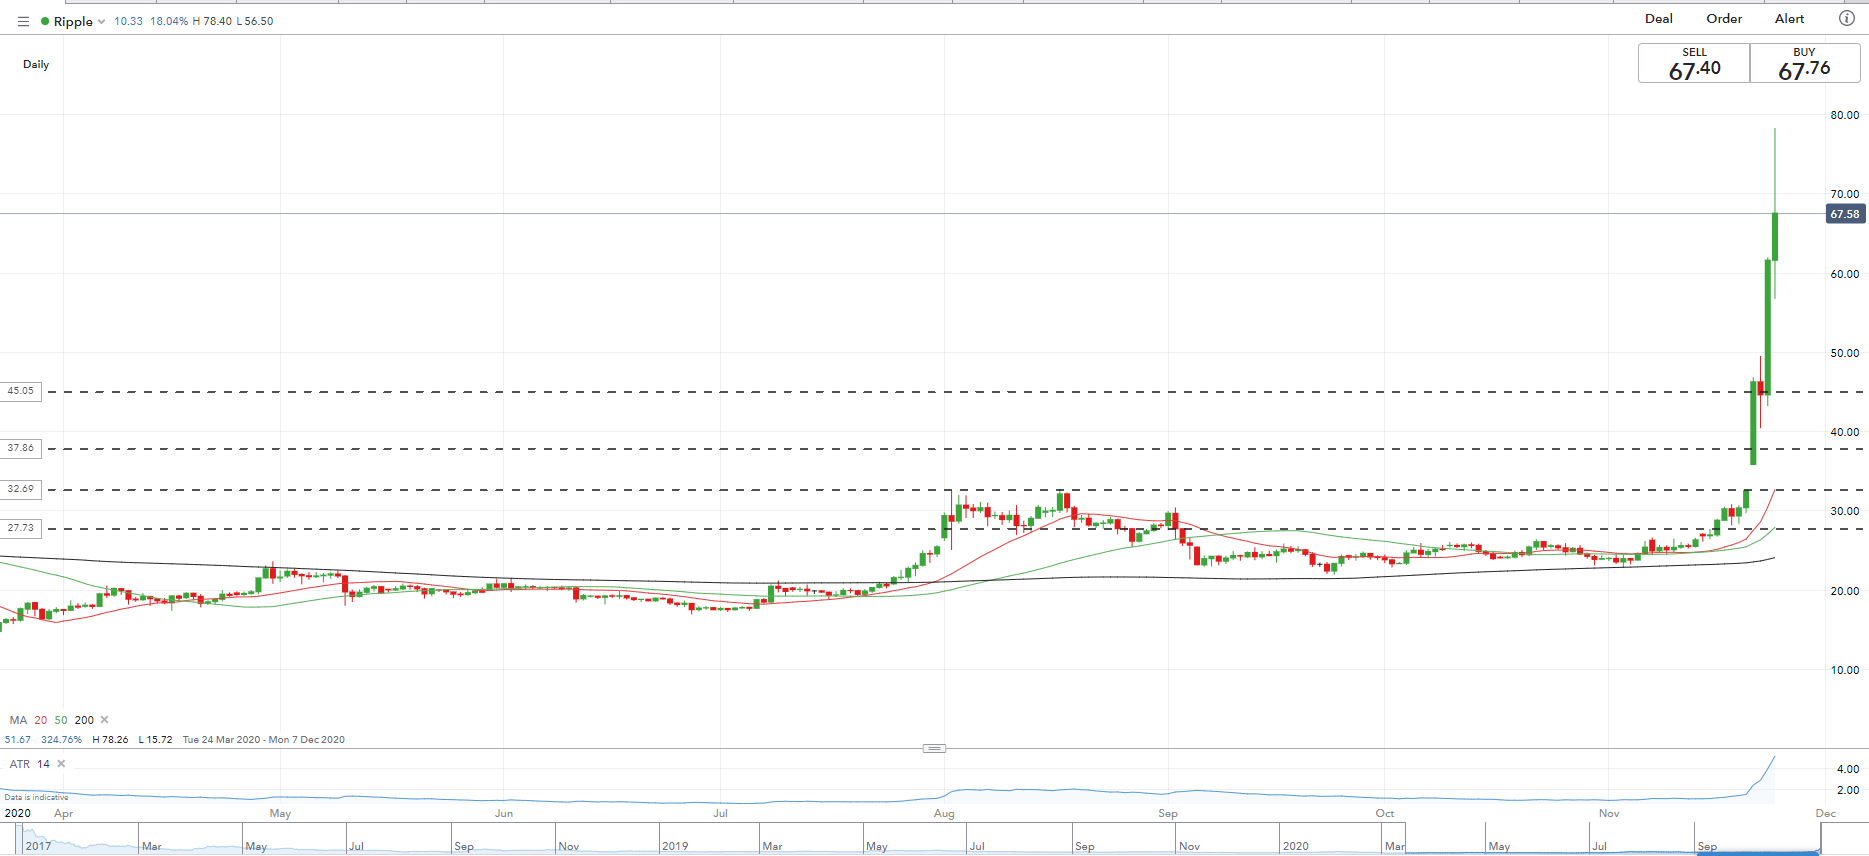
Ripple (XRP/USD) is back in the headlines after months of inactivity and general sideways trade. A break above the double-high in August around $0.325 on Saturday caused the crypto to gap higher before accelerating over the next 2-3 days to trade at a high of just over $0.78. A brief sell-off back to sub-$0.60 is currently being pared back.
This move higher is maybe a chance for any stale Ripple holders to re-evaluate their holdings. If you look at the IG client sentiment it can be seen that traders have remained heavily long of Ripple for many, many months. The latest reading shows that IG retail traders are still just under 94% net-long of Ripple, an extreme reading. The latest bout of price action and volatility offers the opportunity to either sell or trade old positions.

Ripple Daily Price Chart (April – November 24,2020)
Traders of all levels and abilities will find something to help them make more informed decisions in the new and improved DailyFX Trading Education Centre
What is your view on Bitcoin and Ripple – bullish or bearish?? You can let us know via the form at the end of this piece or you can contact the author via Twitter @nickcawley1.


