IHS MARKIT FLASH PMI REPORT SENDS US DOLLAR, DOW JONES HIGHER
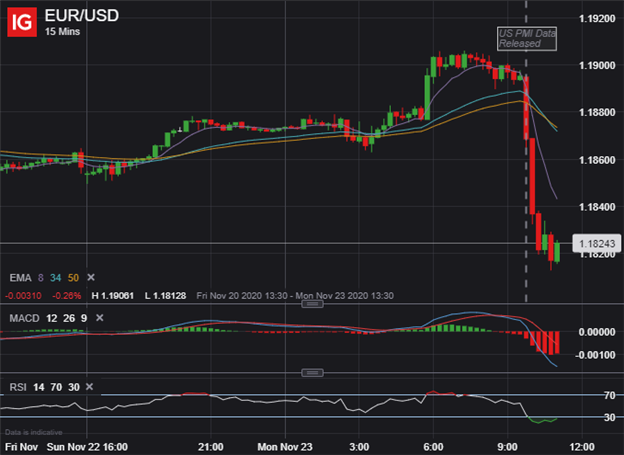
- EUR/USD price action pivots 70-pips lower in a big intraday reversal
- Dow Jones jumps about 1% higher as stocks erase recent downside
- US PMI data released by IHS Markit looks to have catalyzed the move
The US Dollar is surging while major stock indices like the Dow Jones push higher in immediate response to flash PMI data just released by IHS Markit for November. The monthly PMI report crushed market forecast for both manufacturing and services sector components, which propelled the headline composite index reading to 57.9 and a five-plus year high.


US PMI REPORT (IHS MARKIT) - NOVEMBER 2020

Chart Source: DailyFX Economic Calendar
This sparked a huge reversal lower by EUR/USD with spot prices sinking over 70-pips in response to the move. US Dollar strength looks broad-based as USD price action gains across major currency pairs. Likewise, the Dow Jones, S&P 500 and Nasdaq extended higher following better-than-expected PMI data release after gaining modestly at the New York opening bell.
| Change in | Longs | Shorts | OI |
| Daily | -8% | -11% | -9% |
| Weekly | -15% | 25% | -4% |
Gold prices fell sharply while the DXY Index and Treasury yields advanced. A notable uptick in business activity and employment detailed in the latest US PMI report likely provides traders with reasons to be optimistic on the United States - particularly in light of less encouraging PMIs out of the Eurozone.
EUR/USD PRICE CHART: 15-MINUTE TIME FRAME (20 NOV TO 23 NOV 2020)

EUR/USD price action now trades down about 0.3% intraday and around the 1.1820-level, which roughly aligns with last week’s low. Failing to hold this potential technical support level could see EUR/USD selling pressure accelerate toward the mid-point retracement of its month-to-date range near the 1.1760-mark.
That all said, it is also worth mentioning that the ongoing influx of US Dollar demand is likely being exacerbated by a squeeze as EUR/USD longs unwind their positions after being caught offsides headed into the Thanksgiving holiday and month-end. Furthermore, robust US economic data could downplay the urgency of another fiscal stimulus package or additional accommodation from the Federal Reserve, which could provide bullish tailwinds to the US Dollar and bearish headwinds to equities.
-- Written by Rich Dvorak, Analyst for DailyFX.com
Connect with @RichDvorakFX on Twitter for real-time market insight


