


New Zealand Dollar, NZD/JPY, NZD/USD, RBNZ, Funding-for-Lending Program – Talking Points:
- Robust economic data and a less dovish stance from the RBNZ may underpin the New Zealand Dollar.
- NZD/USD poised to extend climb after breaching key chart resistance.
- NZD/JPY rates eyeing a push to yearly highs as prices carve out a Bull Flag continuation pattern.
The New Zealand Dollar seems poised to continue outperforming its haven-associated counterparts, on the back of better-than-expected economic data and a less dovish stance from the Reserve Bank of New Zealand.
The RBNZ had been one of the more dovish central banks since the coronavirus crash in March, hinting at the imposition of a negative interest rate policy (NIRP) and potentially intervening in the FX market to stymie NZD’s recent appreciation.
However, the implementation of these measures is beginning to look less probable after Assistant Governor Christian Hawkesby stated that “if the banks don’t like having a negative OCR, then passing on as much of the Funding for Lending Program as possible through into lower lending rates is going to reduce the likelihood that a negative OCR is needed”.

New Zealand 2-year Government Bond yields daily chart created using Tradingview
The Monetary Policy Committee “agreed to provide additional monetary stimulus to the economy” at its November meeting through the introduction of the FLP in early December, which is expected to “reduce banks’ funding costs and lower interest rates”.
Indeed, regional debt markets have rapidly discounted the potential for additional rate cuts following the decision, with the yield on 2-year New Zealand Government Bonds surging back above the sentiment-defining 200-day moving average for the first time since mid-July.
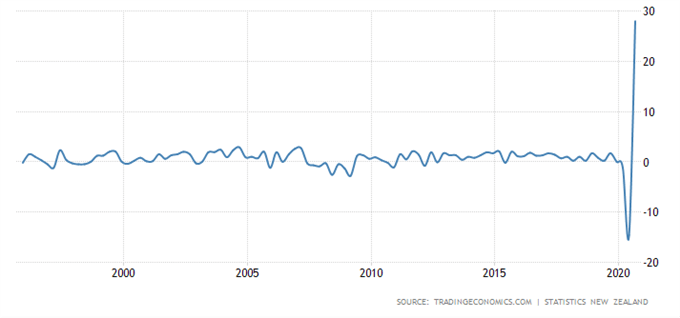
Moreover, with the unemployment rate rising less than consensus estimates and seasonally adjusted retail sales surging a record 28% in the third quarter, policymakers may hesitate to loosen monetary policy conditions further in the near term.
Therefore, the cyclically-sensitive New Zealand Dollar looks set to climb higher against the lower-beta Japanese Yen and US Dollar, if upcoming economic data continues to show the local economy robustly recovering from the March nadir.
New Zealand Retail Sales QoQ
NZD/USD Daily Chart – Break of Resistance Hints at Gains
The technical outlook for NZD/USD rates remains tilted to the upside, as prices begin to probe the 38.2% Fibonacci (0.6954) after breaching Ascending Channel resistance.
With the RSI hovering in overbought territory and the MACD indicator surging to its highest levels since late June, the path of least resistance seems to favour the upside.
A daily close above the December 2018 high (0.6969) is probably required to neutralize near-term selling pressure and carve a path for buyers to challenge the June 2018 high (0.7060).
Alternatively, a pullback towards Ascending Channel resistance-turned-support may be on the cards if the psychologically imposing 0.7000 mark holds firm.
A daily close below the November 17 low (0.6875) likely precipitating a retest of support at the September high (0.6798).
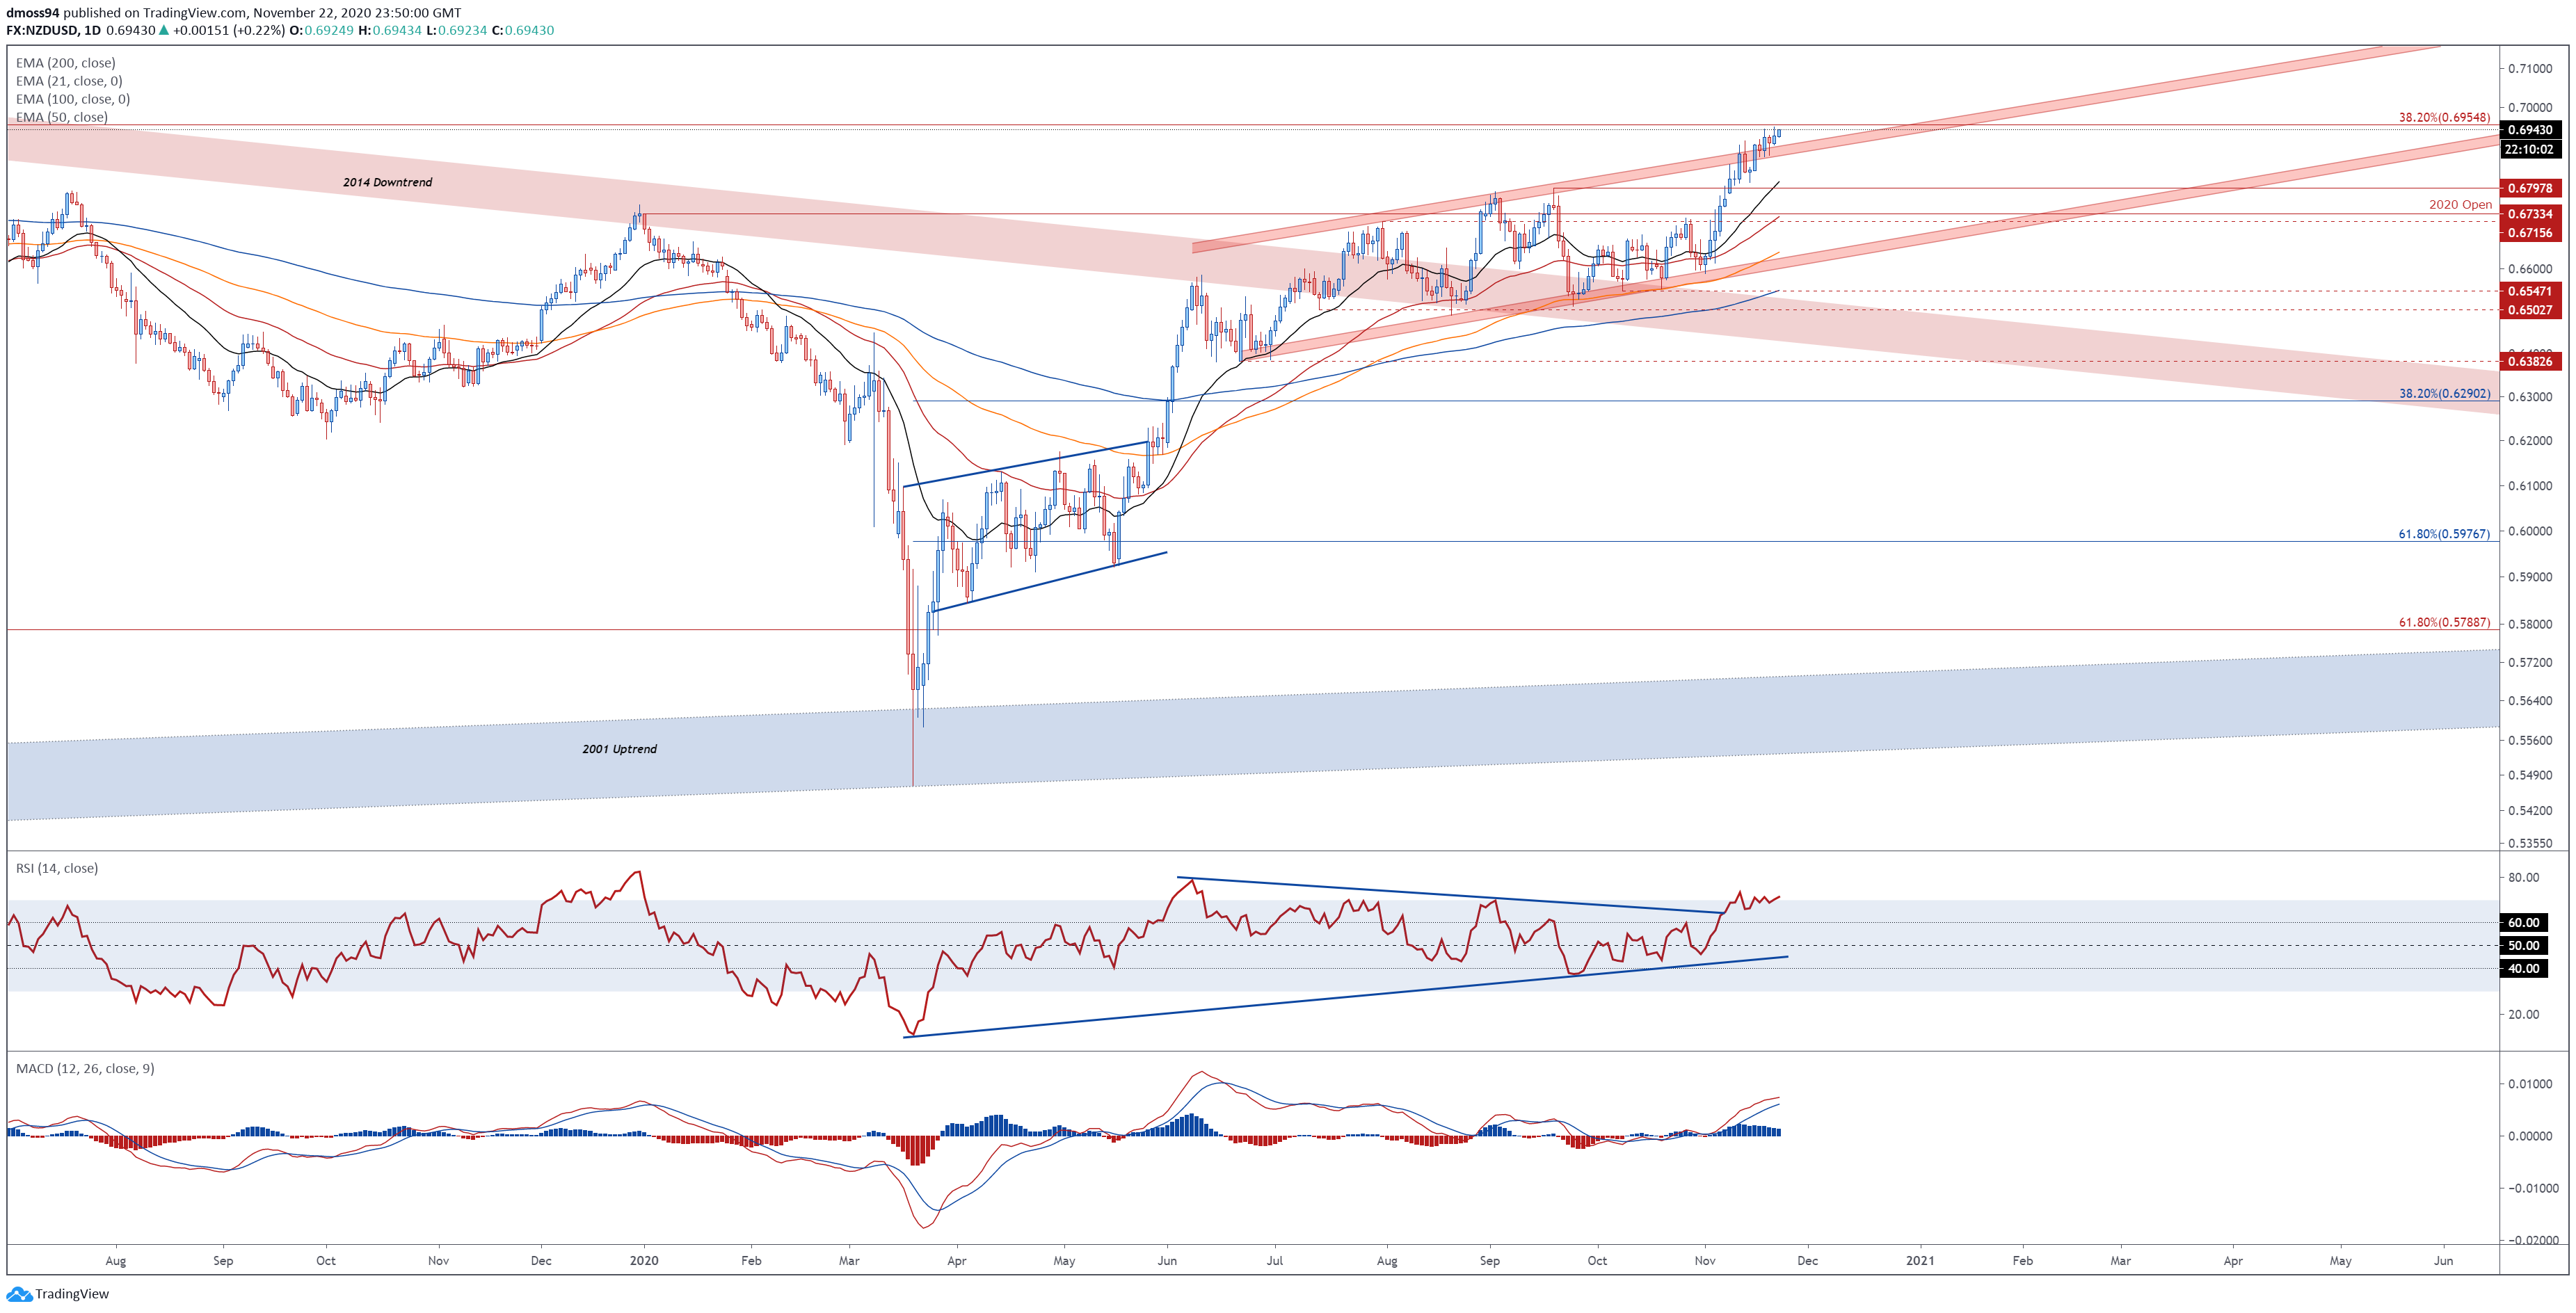
NZD/USD daily chart created using Tradingview
NZD/JPY Daily Chart – Bull Flag in Play?
NZD/JPY rates appear to be gearing up to retest the yearly high, as prices carve out a Bull Flag continuation pattern above key support at the June high (72.18).
The development of the RSI hints at building bullish momentum, as the oscillators holds above 60 and eyes a push into overbought territory for the second time this month.
Breaking through resistance at the January breakaway gap (72.18) would likely bring the November 12 high (72.79) into focus.
Ultimately, a daily close above 72.80 is needed to validate the bullish continuation pattern and could result in price surging as much as 4% from current levels to fulfil the implied measured move (75.54).
Conversely, pushing back below the June high (71.67) may encourage would-be sellers and result in a pullback towards the trend-defining 50-day moving average (70.57).

NZD/JPY daily chart created using Tradingview
-- Written by Daniel Moss, Analyst for DailyFX
Follow me on Twitter @DanielGMoss


