


Dow Jones, DAX 30, FTSE 100 Forecasts: Neutral
- The Dow Jones has bounced between multiple Fibonacci levels as it gradually bleeds lower
- The DAX 30 has etched out an ascending triangle pattern, hinting at potential bullishness
- The FTSE 100 has climbed far and fast but looks susceptible to shorter-term weakness
Dow Jones Technical Forecast
Outlook: Neutral
After soaring higher on covid vaccine news earlier this month, stocks have begun to slow their ascent and solidify recent gains. While recent price action has seen the Dow Jones bleed lower to a degree, the longer-term outlook remains encouraging as the index rests just a few percentage points beneath its all-time high. Thus, recent losses could be viewed as healthy consolidation in the longer-term outlook.
Dow Jones Price Chart: 1 – Hour Time Frame (November 2020)
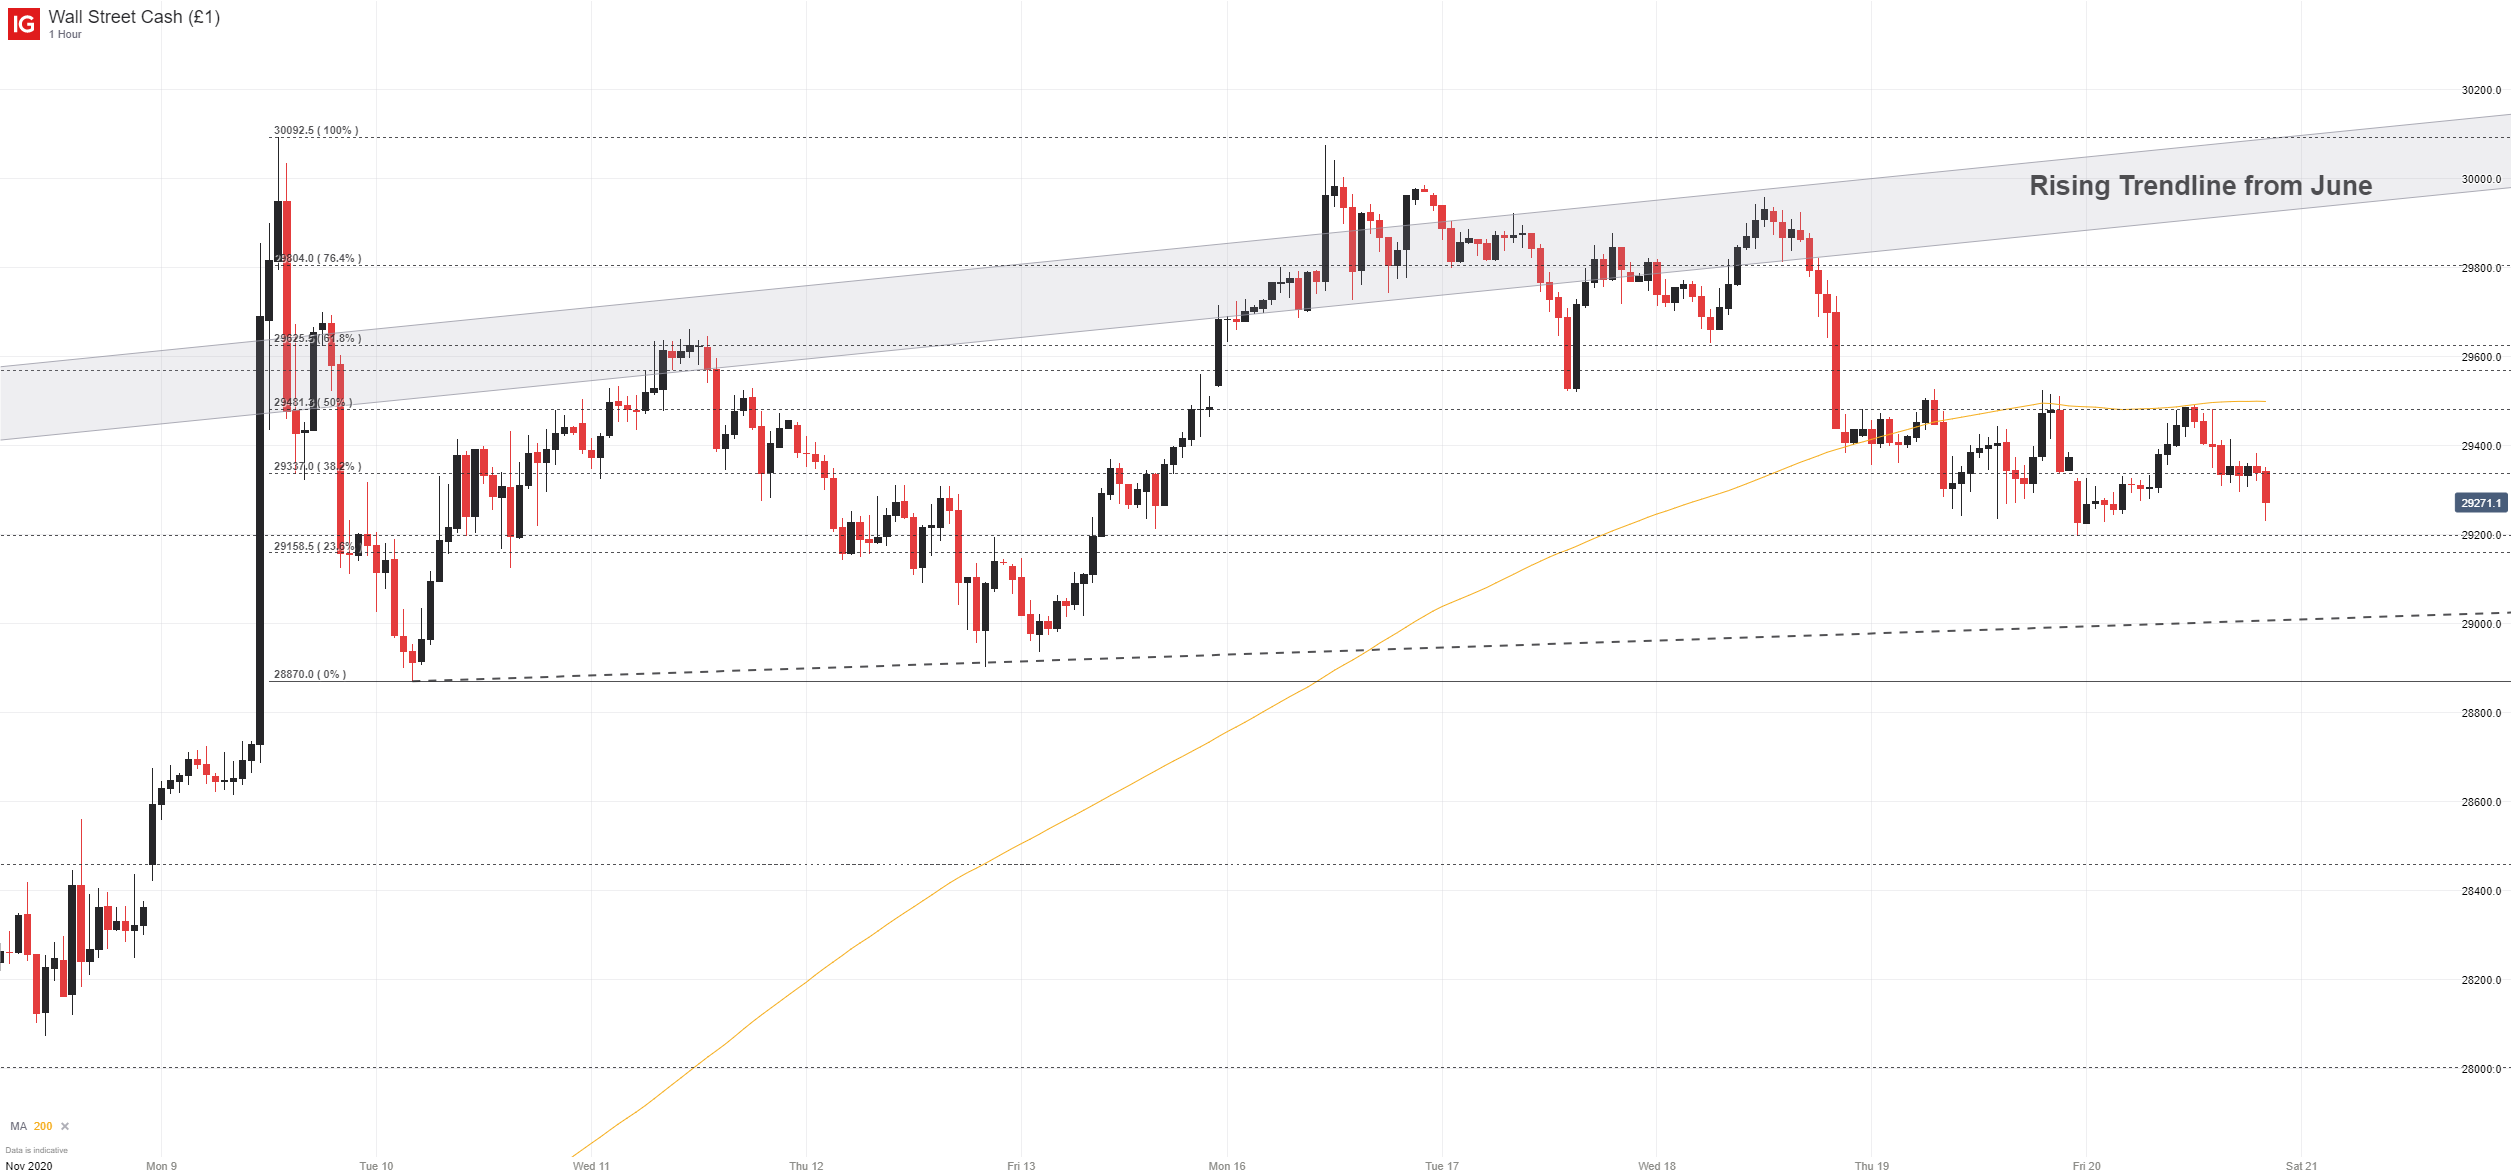
Either way, the Dow Jones might continue to bounce between nearby technical levels. To the topside, initial resistance seems to reside along the Fibonacci level at 29,480. In terms of support, two Fibonacci levels beneath the current trading price, at 29,190 and 29,160 respectively, might work together to keep the Dow afloat should bearishness persist. If broken, subsequent support may reside along the ascending trendline projection from the November lows roughly around 29,000.
DAX 30Technical Forecast
Outlook: Bullish
The DAX 30 has also begun to consolidate recent gains and has worked itself into an ascending triangle pattern as a result. Typically viewed as a continuation pattern, the ascending triangle could hint the DAX 30 is titled higher still. With that in mind, a bearish break beneath the lower bound of the triangle could seriously undermine the bullish formation. On the other hand, a break to the topside, could lend itself to break out trading strategies. In the meantime, follow @PeterHanksFX on Twitter for updates and analysis.
DAX 30 Price Chart: 4 – Hour Time Frame (July 2020 – November 2020)

FTSE 100 Technical Forecast
Outlook: Neutral
The FTSE 100 finds itself in a similar position. Surging from the lower-bound of its range dating back to June, the outlook of the FTSE has undoubtedly shifted since its remarkable break out. Residing around the July highs, the FTSE 100 has slipped into a consolidation pattern of its own. Since the fundamental outlook remains largely uncertain, the FTSE 100 seems susceptible to shorter-term weakness.
FTSE 100 Price Chart: 4 – Hour Time Frame (June 2020 – November 2020)

Initial support might reside around the 6,200 mark while early resistance could rest near the June high of 6,510.
--Written by Peter Hanks, Strategist for DailyFX.com


