


S&P 500, NIKKEI 225, ASIA-PACIFIC MARKET OUTLOOK:
- S&P 500 index futures trading higher on Monday, setting a positive tone for the week ahead
- Asia-Pacific stocks may be inspired by a positive US lead and the signing of the RCEP trade pact
- The Nikkei 225 and ASX 200 stock indexes appear to be positioned to aim for higher levels
S&P 500 Index, RCEP Trading Bloc, Chinese Data:
US stocks rallied on Friday as the advisors of the President-elect Joe Biden opposed a nationwide lockdown to contain virus spread. The S&P 500, Dow Jones and Nasdaq index closed 1.37%, 1.36% and 1.02% higher respectively. US equity futures extended gains on Monday, setting a positive tone for Asia-Pacific exchanges at the open.
More encouragingly, fifteen major Asia-Pacific economies have inked a free trade agreement called the Regional Comprehensive Economic Partnership (RCEP) after eight years of negotiation. The trading bloc is formed by ten ASEAN counties, China, South Korea, Japan, Australia and New Zealand that aims to strengthen the region’s trade and economic activity.
Despite rapidly rising coronavirus numbers around the globe, investors appear to be looking beyond current headwinds. The S&P 500 index finished Friday near its all-time high. Australia’s ASX 200 and Japan’s Nikkei 225 indexes have both broken key resistance levels and aim for higher highs. Future fiscal and monetary stimulus measures under Biden’s presidency are closely eyed, and the breakthrough in Pfizer’s coronavirus vaccine is another booster for equity sentiment.
On the macro front, Chinese retail sales and industrial production figures are among the top events on Monday. Economists anticipate continuous improvement in retail sales, with October’s YoY growth expected at 4.9% (chart below). However, industrial production is forecasted to slow down slightly to 6.5% from 6.9% a month ago. Find out more on the DailyFX economic calendar.
Assets that might be sensitive to Chinese data include the Australian Dollar, the New Zealand Dollar, the offshore Yuan (USD/CNH), the China A50 index and Hong Kong’s Hang Seng Indexequities benchmark.
China Retail Sales Growth (YoY) Forecasts

Source: Bloomberg, DailyFX
Sector-wise, all eleven S&P 500 sectors closed in the green, with 80.4% of the index’s constituents ending higher on Friday. Energy (+3.54%), real estate (+2.00%) and industrials (+1.70%) were among the best performers, whereas information technology (0.63%) and utilities (0.79%) registered smaller gains.
S&P 500 Sector Performance 13-11-2020

Source: Bloomberg, DailyFX
For the week ahead, here are the key market events:


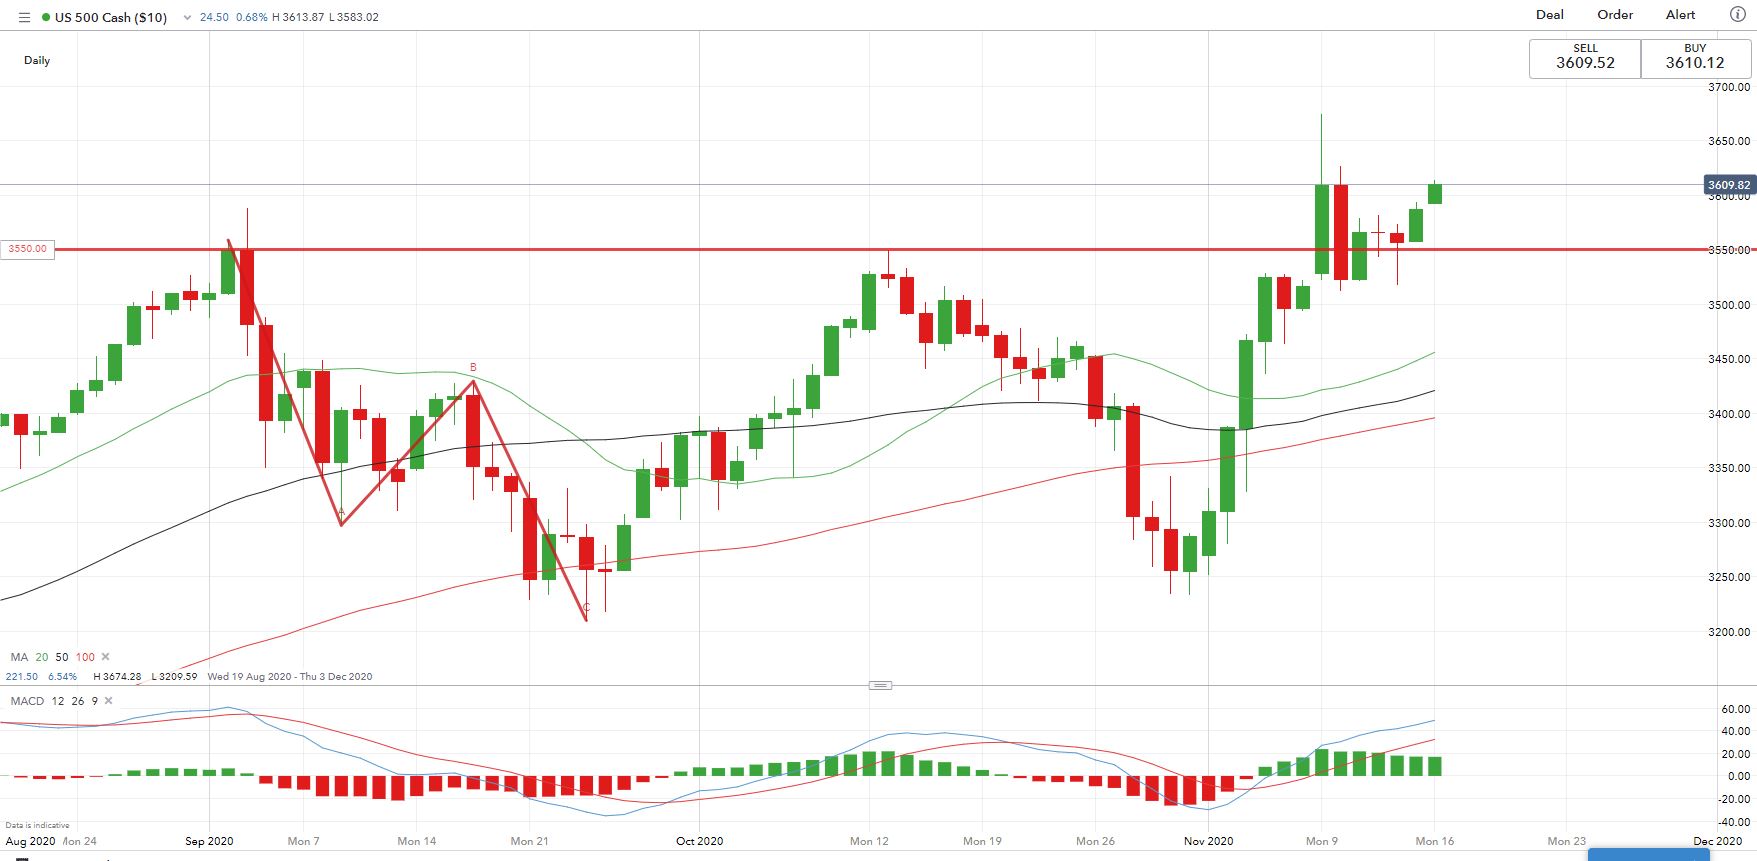
Technically, the S&P 500 index has likely broken a key resistance level at 3,550 and thus opened the door for further upside potential. A brief pullback towards 3,550 last week was perhaps another technical correction in a medium-term bull run. Overall momentum appears bullish-biased as the MACD indicator continues to expand into positive territory. A solid breakthrough of an immediate resistance level at 3,610 may signal further upside toward 3,680 and then 3,730.
S&P 500 Index – Daily Chart
Nikkei 225 Index Outlook:
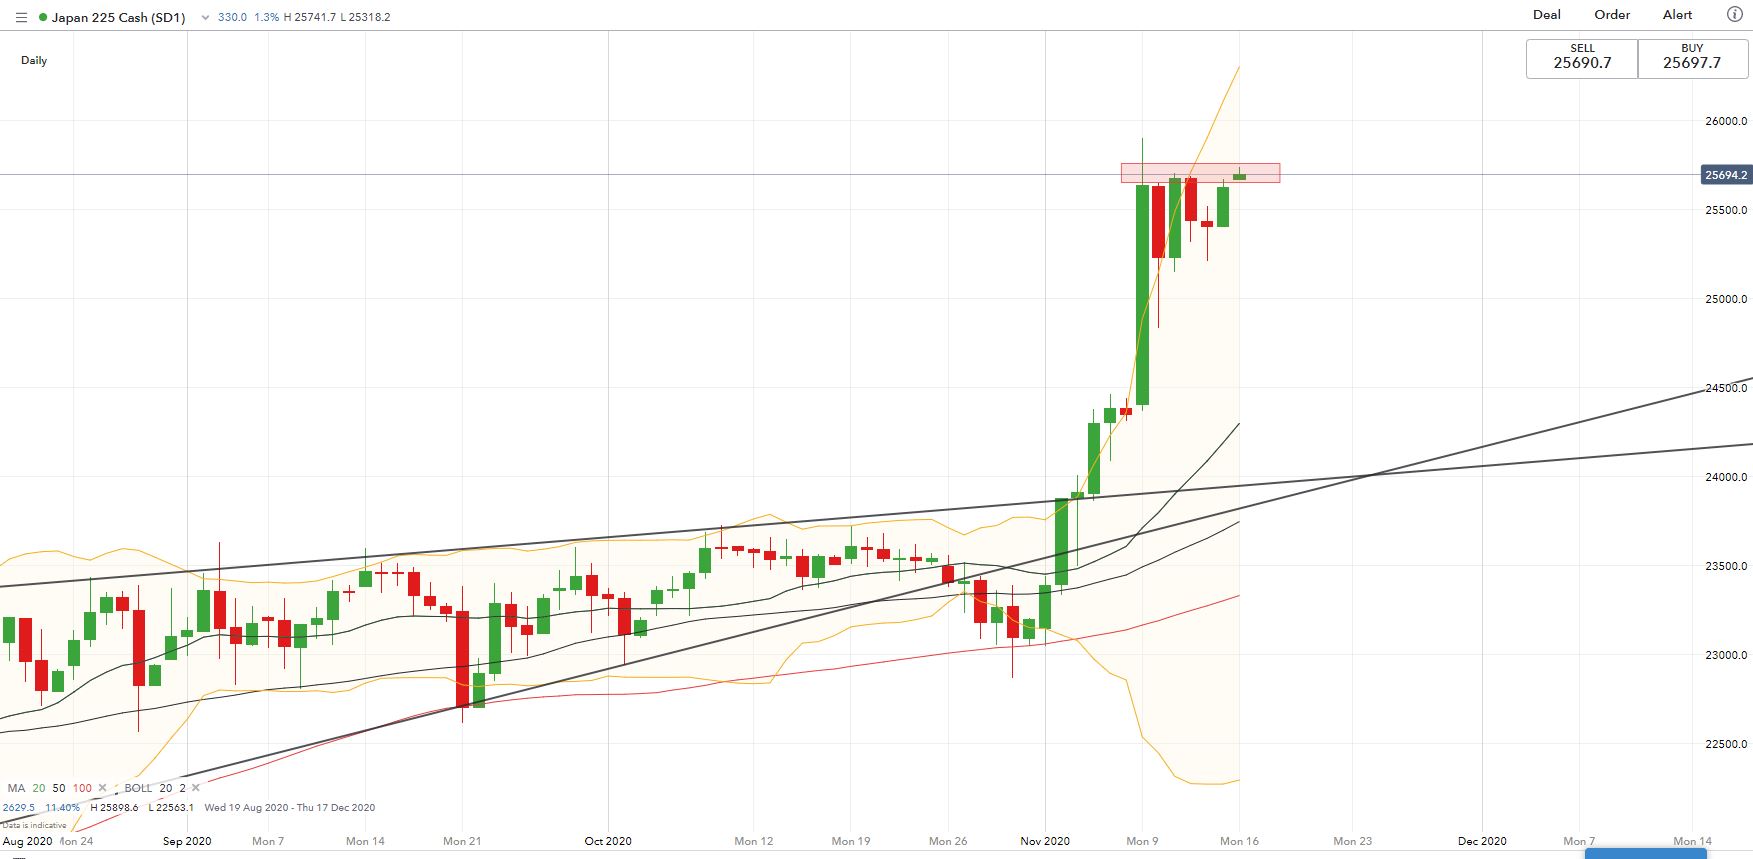
Technically, the Nikkei 225 index broke above the “Ascending Wedge” that it formed since early June, propelled by strong upward momentum. The index is challenging an immediate resistance level at 25,700, breaking above which may open the way for further upside with an eye on 26,000. Bollinger Band width has widened significantly, suggesting strong upward momentum. An immediate support level can be found at 25,230, followed by 24,370.
Nikkei 225 Index – Daily Chart
ASX 200 Index Outlook:
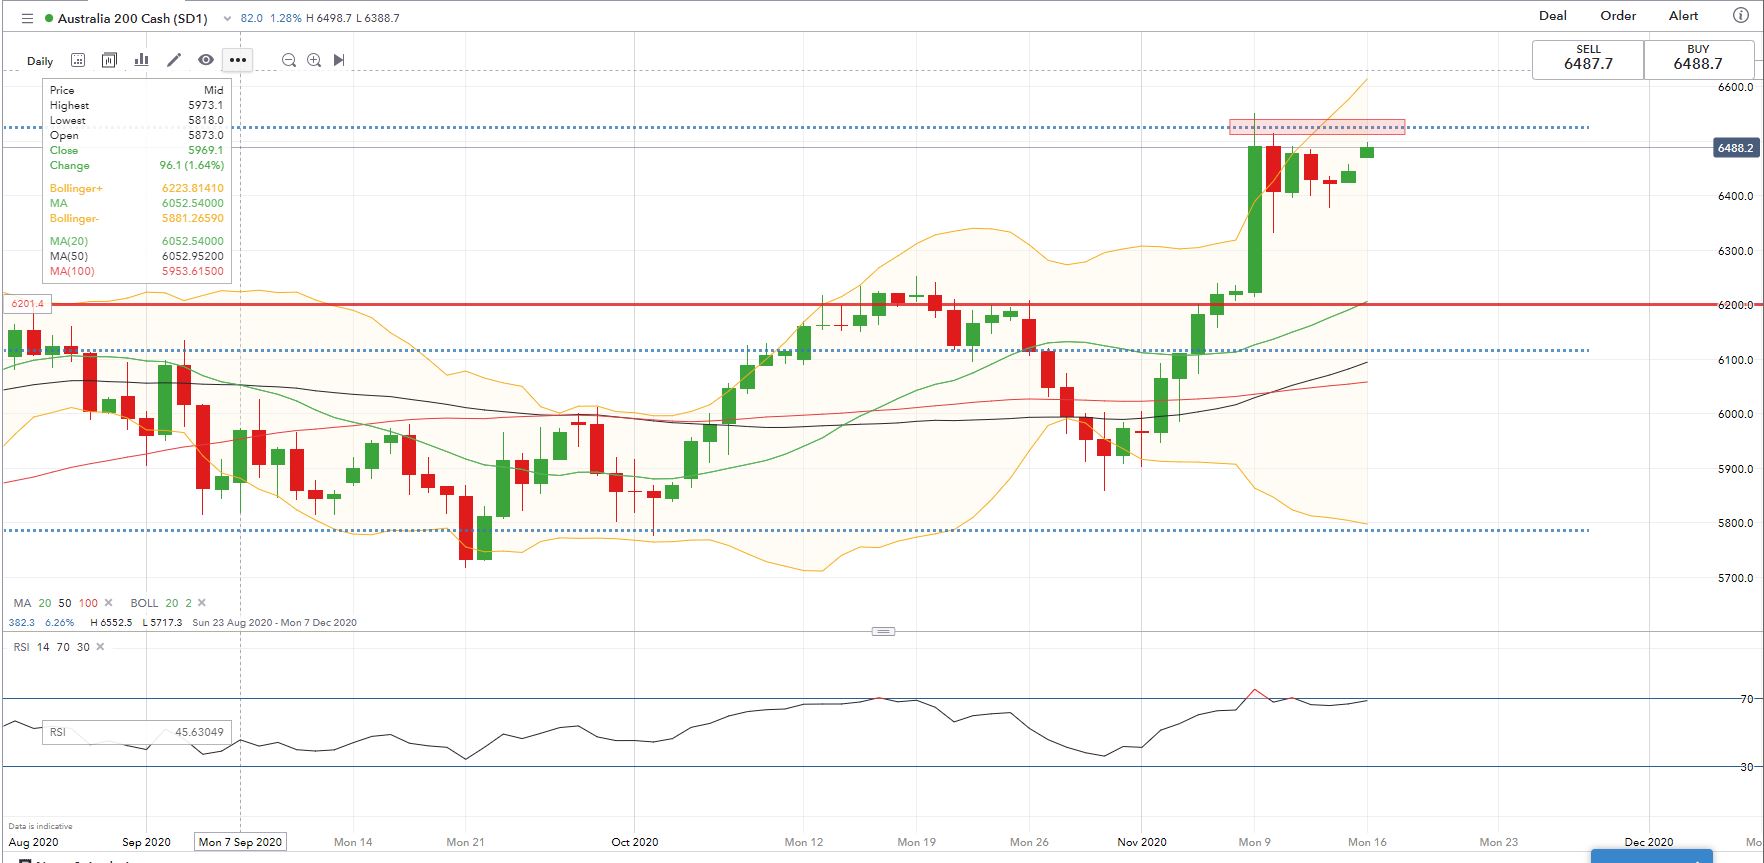
Technically, the ASX 200 index is facing an immediate resistance level at 6,530 – the 76.4% Fibonacci retracement. The overall trend appears bullish-biased, although some near-term consolidation could be seen before it attempts to break the resistance once again. An immediate support level can be found at 6,400.
ASX 200 Index – Daily Chart

--- Written by Margaret Yang, Strategist for DailyFX.com
To contact Margaret, use the Comments section below or @margaretyjy on Twitter


