S&P 500, ASX 200 INDEX OUTLOOK:
- US stocks marched higher with technology shares outperforming; cyclical sectors retreated
- Vaccine enthusiasm appeared to have cooled, stalling a sectoral rotation out of tech
- The ASX 200 index is consolidating beneath a key chart resistance of 6,500
Tech Rally, S&P 500 Index, Asia-Pacific Markets:
US technology stocks registered strong gains on Wednesday after falling sharply amid a vaccine-led sectoral rotation in the previous two days. The Nasdaq index soared more than 2%, the S&P 500 index climbed 0.77%, whereas the Dow Jones index closed marginally lower. This may still set an upbeat tone for Asia-Pacific stocks at open, with the Nikkei 225 and ASX 200 index futures edging higher Thursday morning.
A vaccine-led sectoral rotation appeared to have stalled on Wall Street as enthusiasm cooled. Investors are reassessing near-term implications of a coronavirus vaccine after Pfizer – the world’s largest pharmaceutical company – released encouraging results of an initial phase 3 clinical trial. Big tech companies were hammered as markets attempted to price in a faster pace of economic recovery and reduced demand for digital facilities in view of positive vaccine news.
The road ahead might not be a smooth sailing, however, as challenges remains on the time horizon, manufacturing capacity, delivery and storage of the vaccine even if it is proven safe and effective. Many developing countries may risk a shortage of funding, and a lack of cold-chain logistics to facilitate the mass distribution of the vaccine.
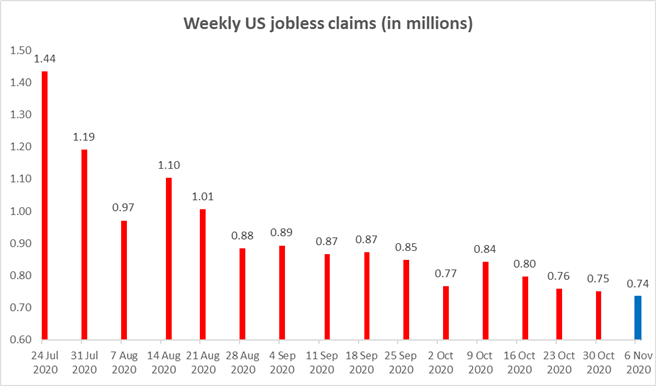
On the macro front, Germany’s inflation rate, UK Q3 GDP and US inflation rate are among the top events today. The US Department of Labor will report the initial jobless claims figure for the week ending November 6th. Markets foresee a 735k increase in unemployment claims, marking a fourth consecutive weekly decline (chart below). Find out more on the DailyFX economic calendar.
US Initial Jobless Claims - Weekly

Source: Bloomberg, DailyFX


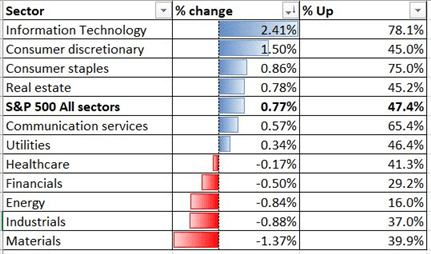
Sector-wise, trading was quite mixed among S&P 500 companies, with 47.4% of the index’s constituents ending higher on Wednesday. Information technology (+2.41%), consumer discretionary (+1.50%) and consumer staples (+0.86%) outperformed, whereas materials (-1.37%), industrials (-0.88%) and energy (-0.84%) were lagging behind.
S&P 500 Sector Performance 11-11-2020

Source: Bloomberg, DailyFX
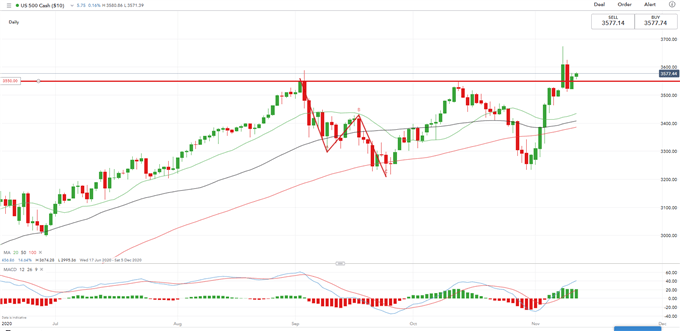
Technically, the S&P 500 index has likely broken a key resistance level of 3,550 with strong upward momentum. The near-term trend appears to bias towards the upside, although some consolidation at around 3,550 might be seen before the index attempts higher highs. An immediate resistance level can be found at around 3,610.


S&P 500 Index – Daily Chart

ASX 200 Index Outlook:
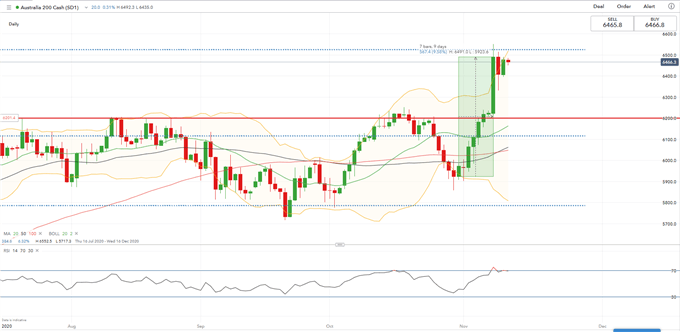
Technically, the ASX 200 appears to have entered a consolidative phase after registering an impressive 9.5% month-to-date gain. The index is facing a key resistance level at 6,525, which is the 76.4% Fibonacci retracement. The overall trend remains bullish-biased, but some short term pullback is possible as the RSI indicator has reached an overbought territory following a strong rally over the past two weeks.
ASX 200 Index – Daily Chart


--- Written by Margaret Yang, Strategist for DailyFX.com
To contact Margaret, use the Comments section below or @margaretyjy on Twitter


