


Bitcoin (BTC/USD) Price, Analysis and Chart:
- Bitcoin (BTC) running ever higher.
- Retail remains long of BTC and sentiment is positive.
Bitcoin continues to press ever higher and is set to break back above $16,000 and potentially higher in this latest move. The chart remains positive overall with higher lows dominating the chart and while BTC may be overbought – using CCI – this move is not yet overly extended. Other plus-points include BTC above all three moving averages, with the 20- simple dma trading above the 50-sdma in mid-October around the mid-$11,000s a bullish momentum signal.

Bitcoin (BTC/USD) Daily Price Chart (May – November 12, 2020)
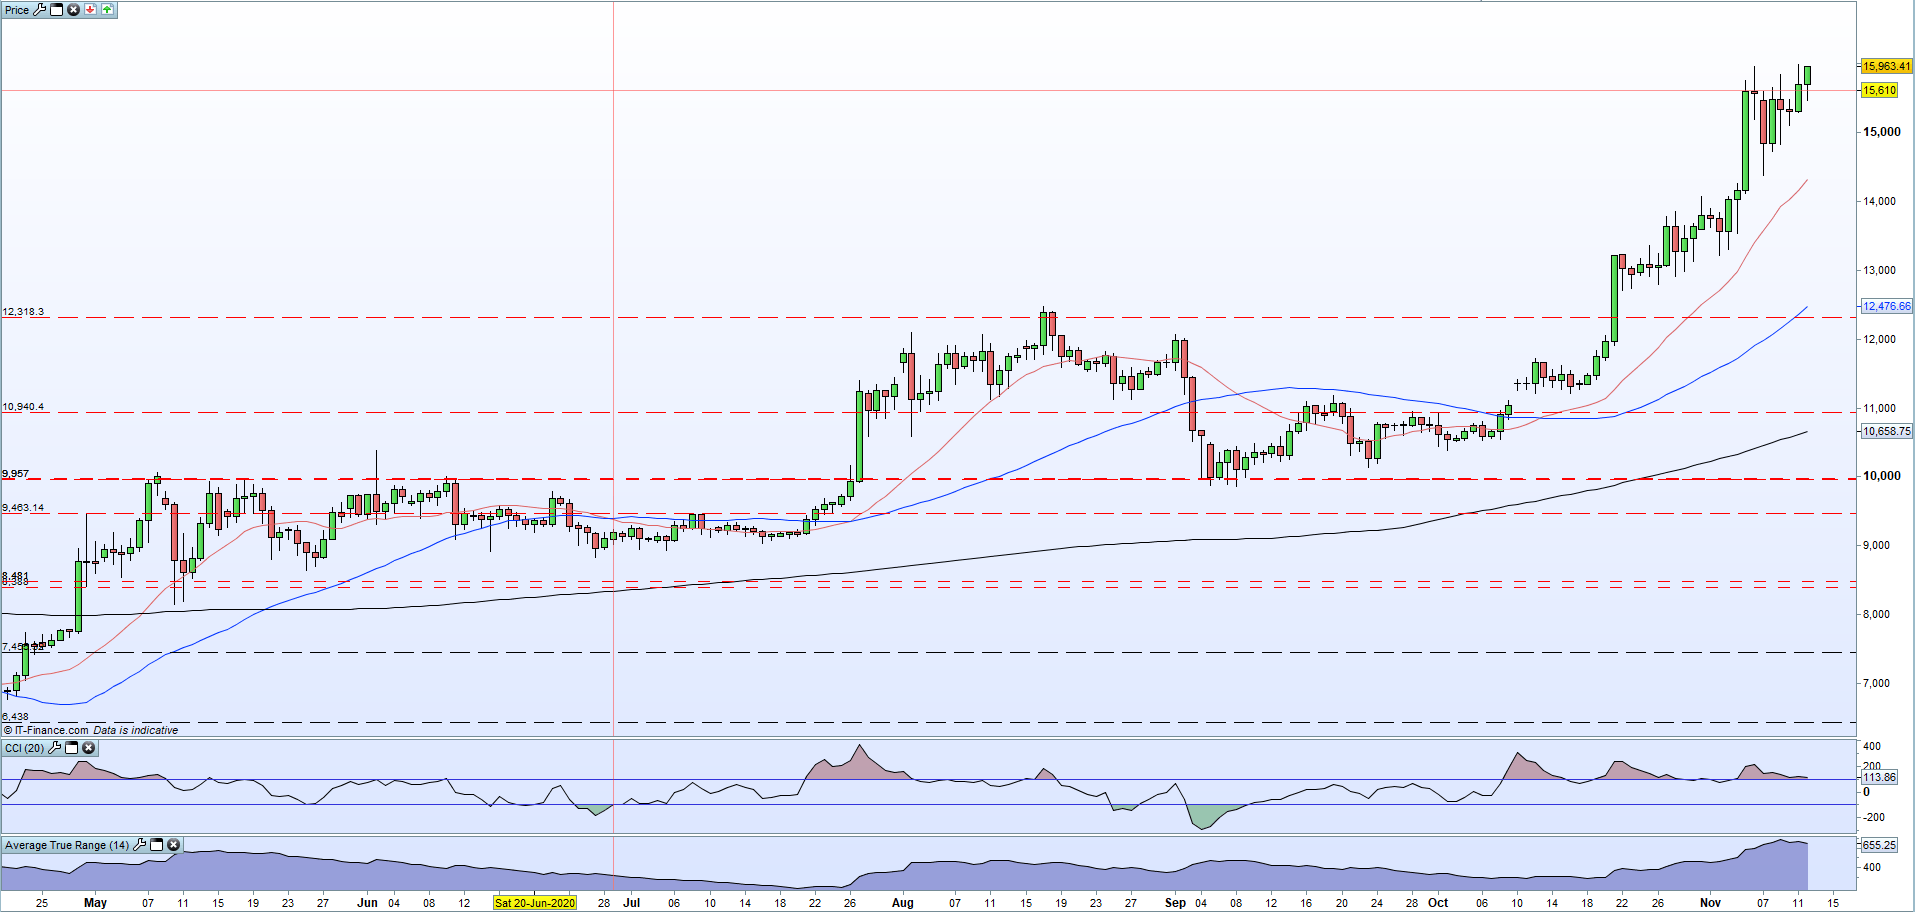
Looking ahead, there seems little in the way of resistance until the early $17,000s, using a longer-dated chart. The January 2018 monthly high of $17,100 is the next level of horizontal resistance ahead of a potential re-trace all the way back to the December 2017 peak at just under $20,000. The volatility in the monthly December 2018 candle produced a price range of over $10,000 while the January candle was around $8,000. This volatility makes it harder to pick accurate levels of resistance as the December buying and the January selling was driven by pure emotion and not technical analysis. Bitcoin’s current volatility is back at multi-month highs around $670 and traders should be wary when trading Bitcoin in the short-term.

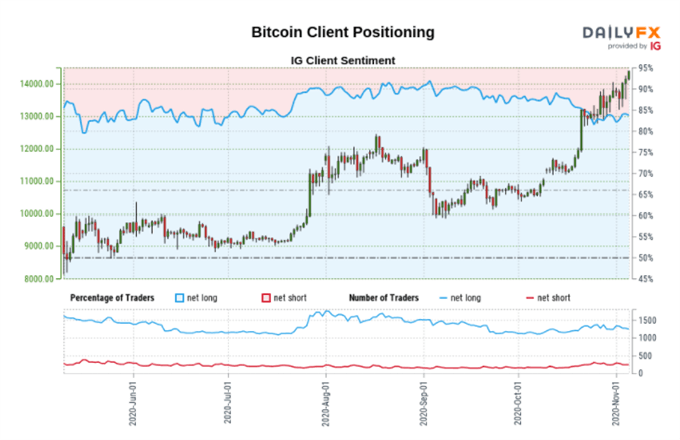
IG client sentiment data show 82.05% of traders are net-long with the ratio of traders long to short at 4.57 to 1.We typically take a contrarian view to crowd sentiment, and the fact traders are net-long suggests Bitcoin prices may continue to fall.Yet traders are less net-long than yesterday and compared with last week. Recent changes in sentiment warn that the current Bitcoin price trend may soon reverse higher despite the fact traders remain net-long.
Traders of all levels and abilities will find something to help them make more informed decisions in the new and improved DailyFX Trading Education Centre
What is your view on Bitcoin – bullish or bearish?? You can let us know via the form at the end of this piece or you can contact the author via Twitter @nickcawley1.


