


NASDAQ PRICE OUTLOOK: STOCK MARKET STILL VOLATILE AS TRUMP CONTESTS ELECTION RESULTS POINTING TO BIDEN PRESIDENCY
- Nasdaq exploded nearly 10% higher this week as stocks soar in the wake of the US election
- The tech-heavy equity index has started to slip from recent highs as Trump refuses to concede
- Stock market volatility could linger owing to the risk of a contested election, COVID-19 fears
The Nasdaq has staged a massive rally over the last few trading sessions in the aftermath of election night. With challenger Joe Biden looking set to claim victory over incumbent Donald Trump, and prospects of a split congress squashing fears of higher corporate taxes, investors have pushed major stock indices notably higher this week. Nasdaq price action surged almost 10% from last Friday’s close while the S&P 500 and Dow both gained about 7% a piece. This coincided with a sharp slide in the US Dollar and breakout in gold prices.
NASDAQ PRICE CHART: DAILY TIME FRAME (07 JUL TO 06 NOV 2020)
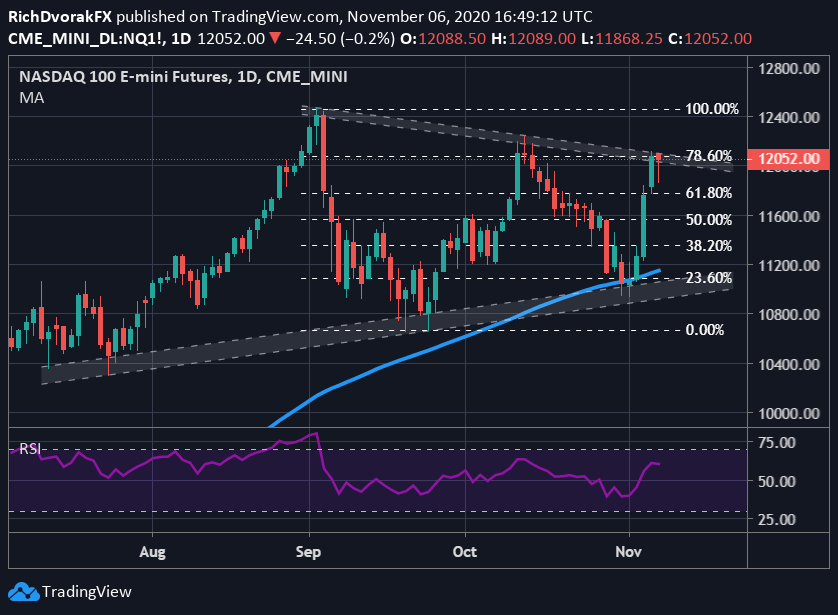
Chart by @RichDvorakFX created using TradingView
However, the tech-heavy Nasdaq is starting to stall as President Trump refuses to concede despite election votes tipping the scales against him across key battleground states, such as Georgia and Pennsylvania. Biden winning electoral college votes from those states should solidify his presidential bid, but lawsuits filed by the Trump campaign could drag out the official election outcome and cause uncertainty to linger.

Nasdaq price action also seems to be struggling at its bearish trendline extended through the 02 September peak and lower swing high notched on 13 October. This area of technical resistance is underpinned by the 78.6% Fibonacci retracement level of September’s selloff as well. That said, if the seemingly unwavering bid beneath stocks can push the Nasdaq above this technical barrier, there could be opportunity to extend toward all-time highs. Another market development that points to potential for the stock market to keep climbing higher includes recent shifts in retail trader positioning.
S&P 500 INDEX PRICE CHART WITH IG CLIENT SENTIMENT OVERLAID: DAILY TIME FRAME (01 JAN TO 06 NOV 2020)
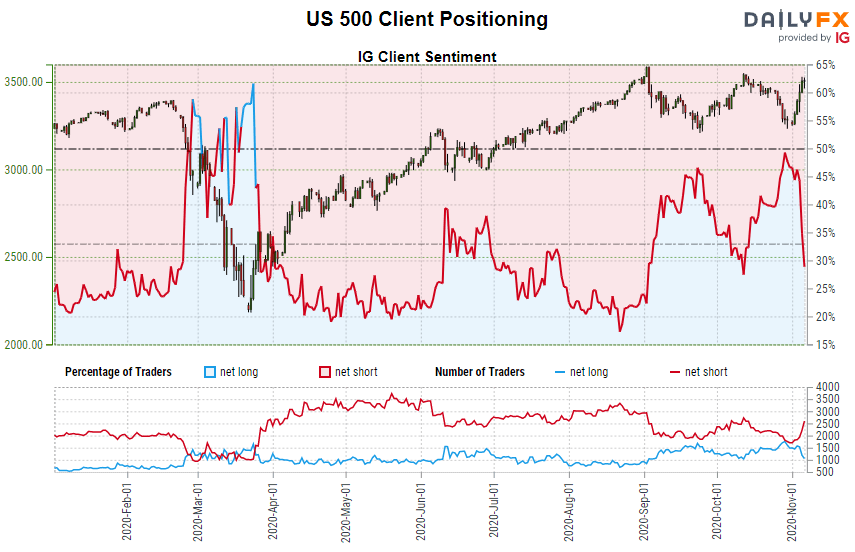
According to the latest IG Client Sentiment figures, retail CFD trader data reveals 33% net-long position for the S&P 500 Index. Recent shifts in positioning detail that the number of S&P 500 traders net-long declined by 25% while the number of net-shorts spiked by 30% week-over-week. Seeing that we typically take a contrarian view to crowd positioning, the combination of current net-short sentiment and recent changes in positioning could signal a relatively stronger bullish contrarian trading bias. Nonetheless, there are considerable market risks on the horizon that could catalyze another risk-off move.
| Change in | Longs | Shorts | OI |
| Daily | 7% | -7% | -1% |
| Weekly | 4% | -7% | -2% |
Most prominent, aside from contested election risk, includes the threat that mounting coronavirus cases poses to the economy. FOMC Chair Jerome Powell stated during Thursday’s Fed decision press conference how the recent course of the pandemic is of particular concern, adding that consumers might pull back on spending due to fears of the virus. Hopes for passing an overwhelming stimulus bill could also weigh negatively on stocks seeing that odds of a democratic sweep have dwindled. Correspondingly, it could be prudent to keep close tabs on the S&P 500-derived VIX Index, or fear-gauge, as a potential bellwether to risk appetite and where stocks might head next.
-- Written by Rich Dvorak, Analyst for DailyFX.com
Connect with @RichDvorakFX on Twitter for real-time market insight


