


GOLD PRICE OUTLOOK: PRECIOUS METALS SURGE TO MUTLI-WEEK HIGHS ON THE BACK OF US DOLLAR WEAKNESS IN WAKE OF ELECTION
- Gold and silver prices rocket higher as precious metals benefit from US Dollar weakness
- Gold price action looks primed to resume its broader uptrend following a bullish breakout
- An unexpected return of market volatility has potential to send gold snapping back lower
Gold and silver prices have notched explosive rallies over the last couple trading sessions. The two precious metals have gained 3.6% and 7.5% respectively month-to-date with their advances likely mirroring the steep decline by the US Dollar. Also, a precipitous drop recorded by the S&P 500-derived VIX Index in the wake of the election also speaks to improved liquidity conditions and perhaps helps explain the boost to gold price action. We discussed these themes as potential catalysts for a bullish breakout by precious metals in our recent gold forecast.
GOLD PRICE CHART: DAILY TIME FRAME (15 JUL TO 05 NOV 2020)
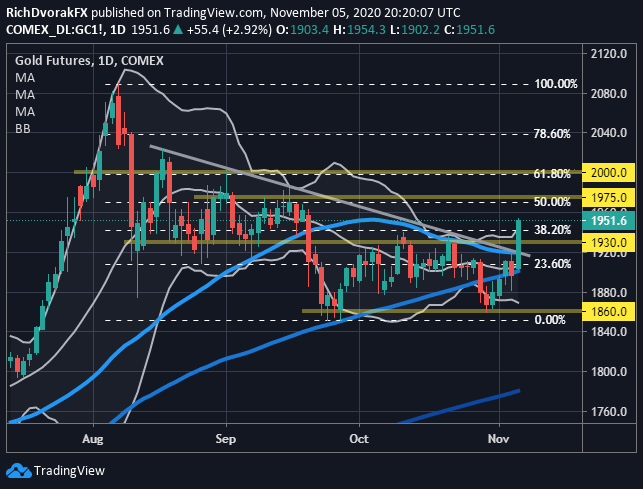
Chart by @RichDvorakFX created using TradingView
Gold price action also looks constructive from a technical perspective. The latest topside breakout above key barriers of resistance, such as the 50-day simple moving average and short-term bearis trendline connecting the string of lower highs since August, seems to unlock more upside potential. Eclipsing October monthly highs and confluent support formed throughout August and September near the $1,930-price level seems to be a notable development for gold bulls as well. This brings the $1,975-price level into focus as the next potential area of technical resistance before the psychologically-significant $2,000-mark comes into play. A Bollinger Band expansion could help facilitate a prolonged advance.
| Change in | Longs | Shorts | OI |
| Daily | -2% | -4% | -3% |
| Weekly | -2% | -8% | -5% |
GOLD PRICE CHART WITH US DOLLAR INDEX OVERLAID: DAILY TIME FRAME (14 APR TO 05 NOV 2020)
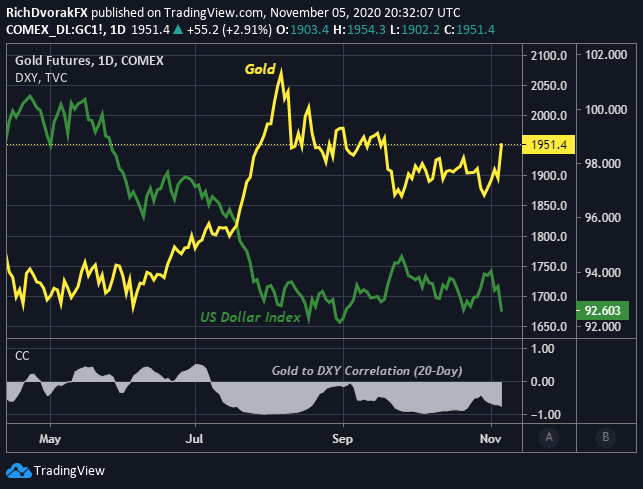
Chart by @RichDvorakFX created using TradingView
That said, it is likely that the price of gold continues to mirror the direction of the US Dollar Index. Gold price action typically maintains a strong inverse relationship with the USD as illustrated in the chart above. Further US Dollar weakness could thus fuel another leg higher in gold and silver prices. On the other hand, a reversal by the US Dollar off multi-year lows, which would likely correspond by an uptick in market volatility, has potential to send precious metals snapping back lower.

-- Written by Rich Dvorak, Analyst for DailyFX.com
Connect with @RichDvorakFX on Twitter for real-time market insight


