Bitcoin (BTC/USD) Price, Analysis and Chart:
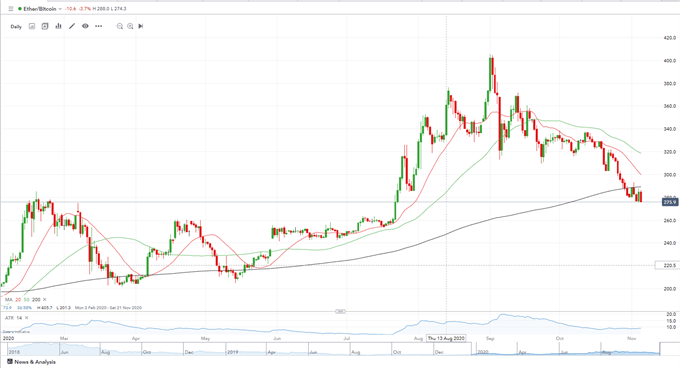
The latest push higher by cryptocurrency favorite Bitcoin has seen the token hit highs last seen back in January 2018. The recent move took has taken out the late-June 2019 high at $13,840 with relative ease and BTC now looks set to press higher, although a period of consolidation cannot be ruled out. The cryptocurrency space as a whole has rallied but most coins/tokens have failed to keep up with Bitcoin with the second-largest cryptocurrency by market capitalization, Ethereum (ETH), being a point in case. The ETH/BTC spread is currently making a fresh multi-month low around 275 after having traded over 400 in September. The sell-off may find an area of support between 242 and 260.
Ethereum (ETH)/Bitcoin (BTC) Spread


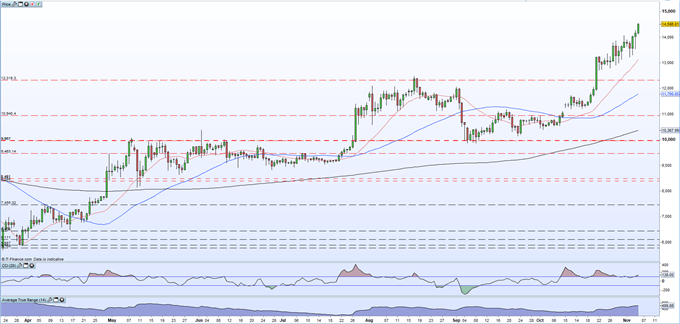
Bitcoin’s daily chart highlights the strong move higher since the $10,000 barrier was broken in early-September. A series of short-term higher-highs and an impressive set of higher-lows since mid-October underscore the strength of the rally. The short-dated simple moving average also broke above the medium-term sma in mid-October, when BTC was changing hands around the $11,500 level, adding a further bullish sentiment to the move. There is little in the way of horizontal resistance on the charts until the January 2018 weekly high around $17,240, before the record, December 2017 high of $19,760 comes into view. As always with cryptocurrencies, volatile price action is just around the corner, but if BTC can consolidate the recent press higher, this move may have more to go.
Bitcoin (BTC/USD) Daily Price Chart (February – November 5, 2020)


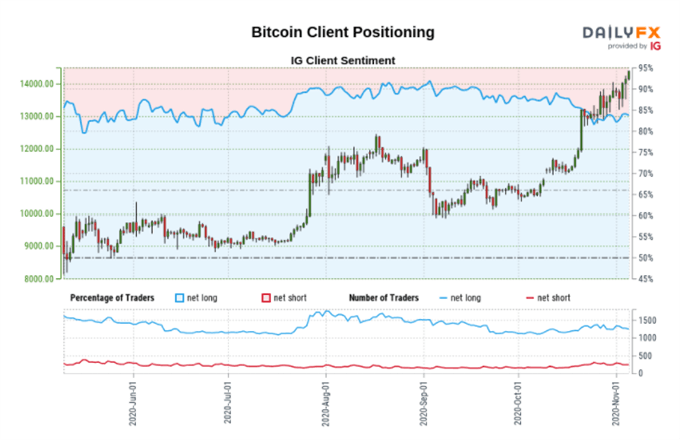
IG client sentiment data show84.32% of traders are net-long with the ratio of traders long to short at 5.38 to 1.Traders are further net-long than yesterday and last week, and the combination of current sentiment and recent changes gives us a stronger Bitcoin-bearish contrarian trading bias.

Traders of all levels and abilities will find something to help them make more informed decisions in the new and improved DailyFX Trading Education Centre
What is your view on Bitcoin and Ethereum – bullish or bearish?? You can let us know via the form at the end of this piece or you can contact the author via Twitter @nickcawley1.


