


CRUDE OIL OUTLOOK:
- WTI crude oil fell 4.6% in two days amid virus and stimulus concerns
- US and Canada oil rig counts continued to climb, according to Baker Hughes
- Oil traders eye Wednesday’s EIA data, expecting a 1.5-million-barrel rise in stockpiles this week
WTI crude oil prices fell for a second day to US$ 38.80, marking a two-day decline of 4.6%. The selloff was primarily due to a rapid rise in global coronavirus infections and dwindling hopes for a US relief package before the presidential election. More than 5 million new Covid-19 cases were reported worldwide in the last 14 days, setting a new record since the pandemic started early this year (chart below).
A two-day climb in the DXY US Dollar index fueled by haven demand also weighed on commodity prices. BP’s chief executive Bernard Looney said in a virtual forum on Monday that the second viral wave may have a larger-than-expected impact on global oil demand.
Falling crude oil prices echo prevailing ‘risk-off’ sentiment, which has also dragged the growth-linked Australian Dollar lower. AUD/USD has fallen 2.3% so far this week, being one of the worst performing G10 currencies.
Worldwide Covid-19 new daily cases

Source: Google
Meanwhile, a Baker Hughes report showed that the total number of active oil rigs in North America is still rising (chart below), which may point to higher upstream supplies. The number of oil rigs in the Unite State increased by 5 to 287, while Canada’s rig count rose by 3 to 83 in the week ending October 23rd. Nonetheless, the current rig count level still marks a sharp fall compared to same time last year due to lower demand.

Source: Baker Hughes
Oil traders may also watch this Wednesday’s EIA inventory reports, expecting a 1.5-million-barrel rise in US crude oil stockpiles. Oil prices have historically exhibited a negative correlation with inventory changes, and the past 12 months’ data can be viewed on the chart below. A much higher-than-expected rise in inventories may exert downward pressure on oil prices, and vice versa.

Source: DailyFX
In the medium term, the US crude inventories have been trending lower since July. This favorable trend, however, was mostly offset by a weakening demand outlook, which was evidenced by lower refinery inputs, gasoline production and distillate fuel production. At 488.1 million barrels, the current level of US crude oil inventories is still about 11% above the 5-year average for this time of year.
Without a substantial cut in production, supply may continue to outpace demand in the oil market amid an escalating second viral wave that may cool appetite for energy and fuel.

Technically, WTI crude oil prices failed again to break a key resistance at the US$ 41.00-41.50 area (highlighted on the chart below) and have entered into consolidative period since. The near-term trend appeared to be bearish-biased as the MACD indicator has likely formed a “Death Cross”. The price has also broken the 20-, 50- and 100- Day Simple Moving Average (SMA) lines simultaneously, opening the room for more downside potential. An immediate support level could be found at US$ 38.6 – the lower Bollinger Band.
WTI Crude Oil Price – Daily Chart

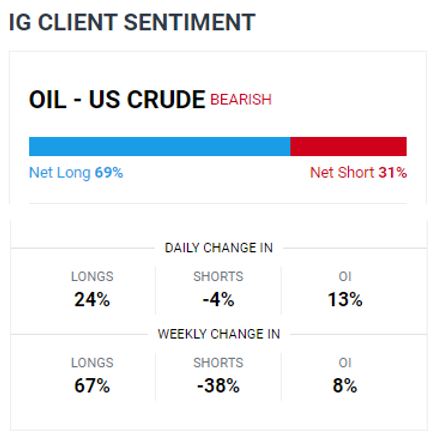
IG Client Sentiment shows that 69% of retail traders are net-long oil, versus 31% that are net-short (chart below). Compared to a day ago, retail traders have significantly increased their long positions (+24%) while shedding short positions (-4%). Compared to a week ago, the number of traders net-long has increased by 67% while the net short side has decreased by 38%. From a contrarian point of view, a drastic change in retail traders’ sentiment towards a long-side bias may infer further weakening in crude oil prices.


--- Written by Margaret Yang, Strategist for DailyFX.com
To contact Margaret, use the Comments section below or @margaretyjy on Twitter


