


Technical Outlook:
- AUD/USD has a solid line of support at 7000
- GBP/USD channel is determining the trading bias
- Silver is hugging an important line of support from March
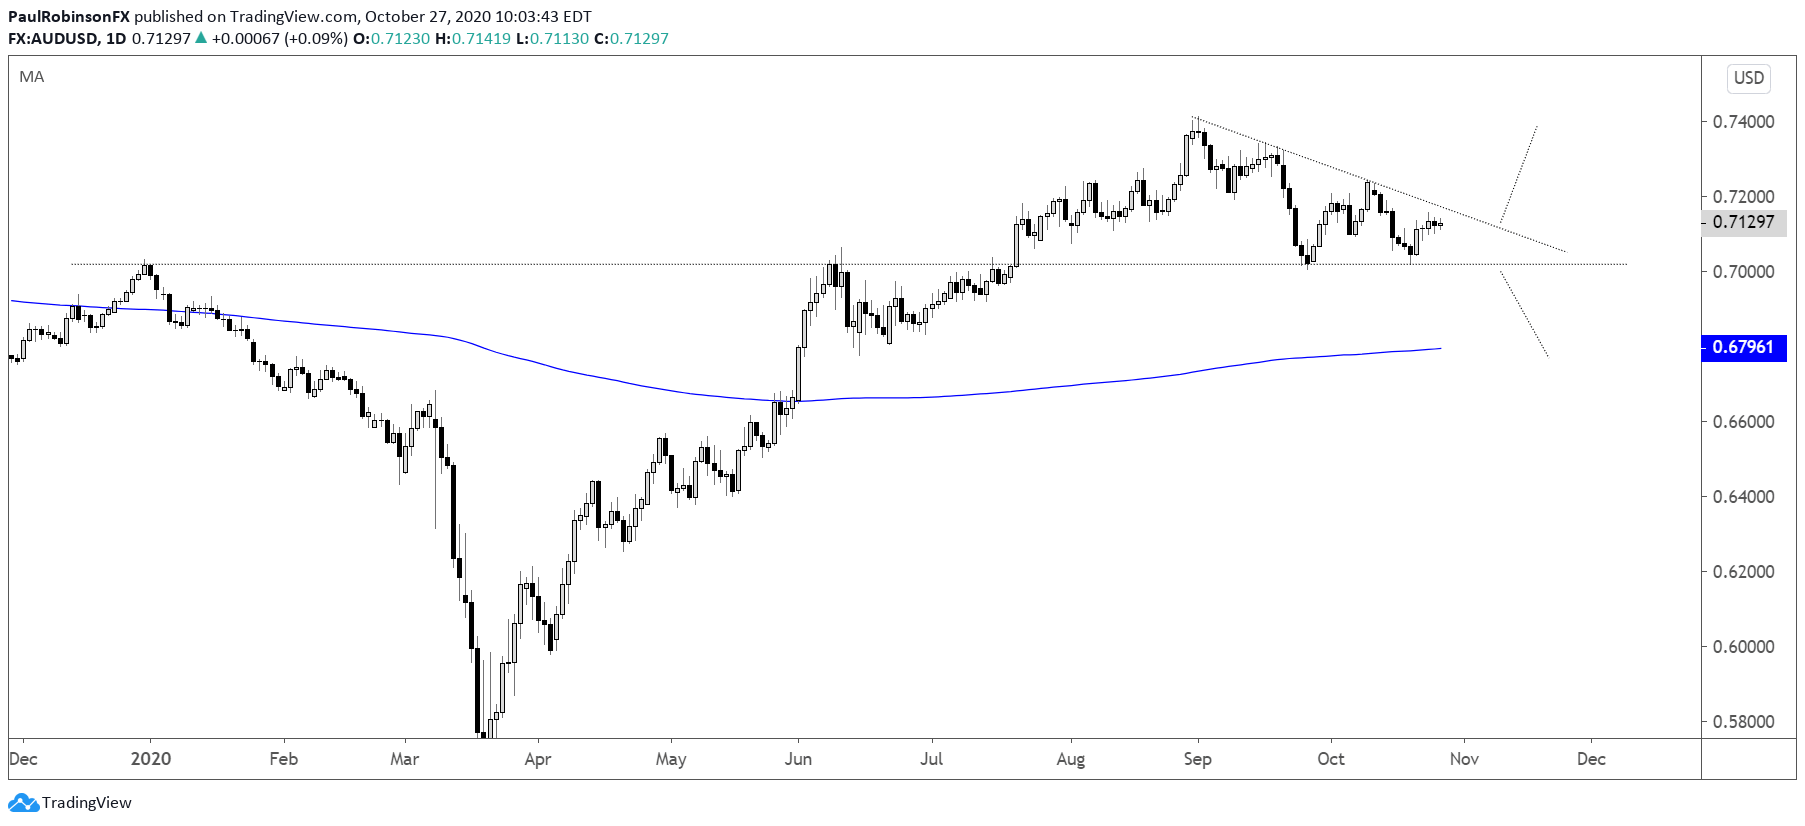
AUD/USD volatility has been diminishing recently with the 7000 line as an important floor. It began as resistance back in January and June, but then became a source of support in late September and just last week. The wedging price action off the Sep 1 high suggests we could soon see a breakout. A drop through 7000 is seen as the smoothest path given the clear floor in place, but we can’t rule out a break of the descending trend-line that makes up the wedge. Either way we should have a resolution soon.
AUD/USD Daily Chart (wedging on 7000)
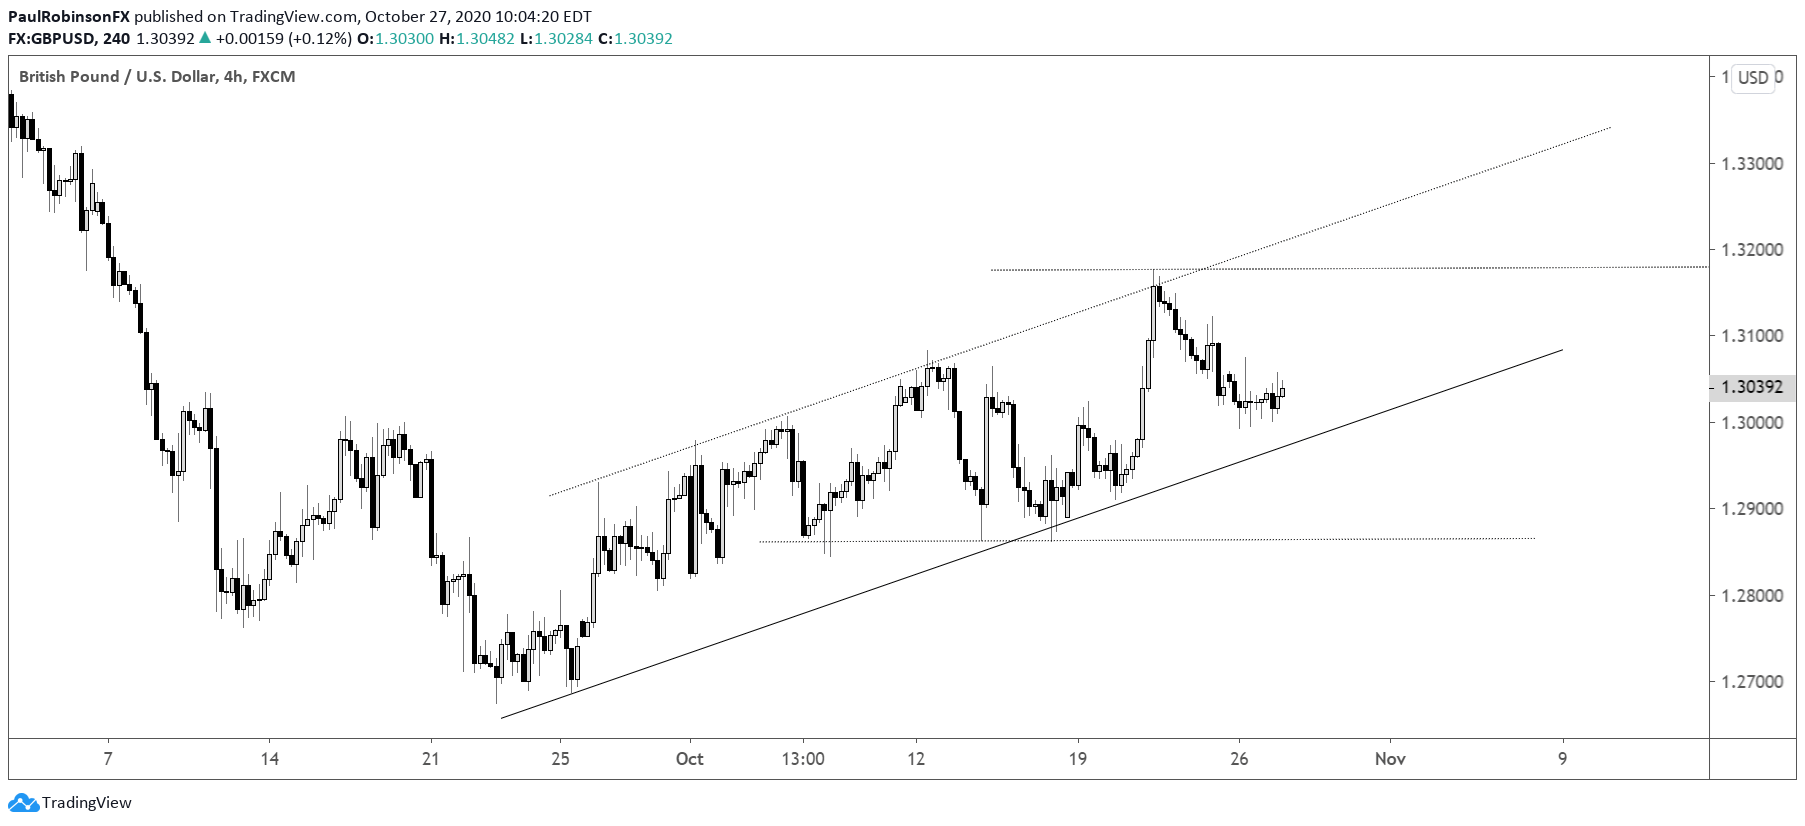
GBP/USDcontinues to abide by the channel off last month’s low, and on that the trading bias remains constructive for as long as it stays above the lower parallel of the structure. Working higher we need to see 13176 crossed to get heading again towards the September 1 high near 13500. A break of the lower line of the channel will tilt the board towards lower levels and could set off selling towards the 200-day at 12700.

GBP/USD 4-hr Chart (rising in channel)
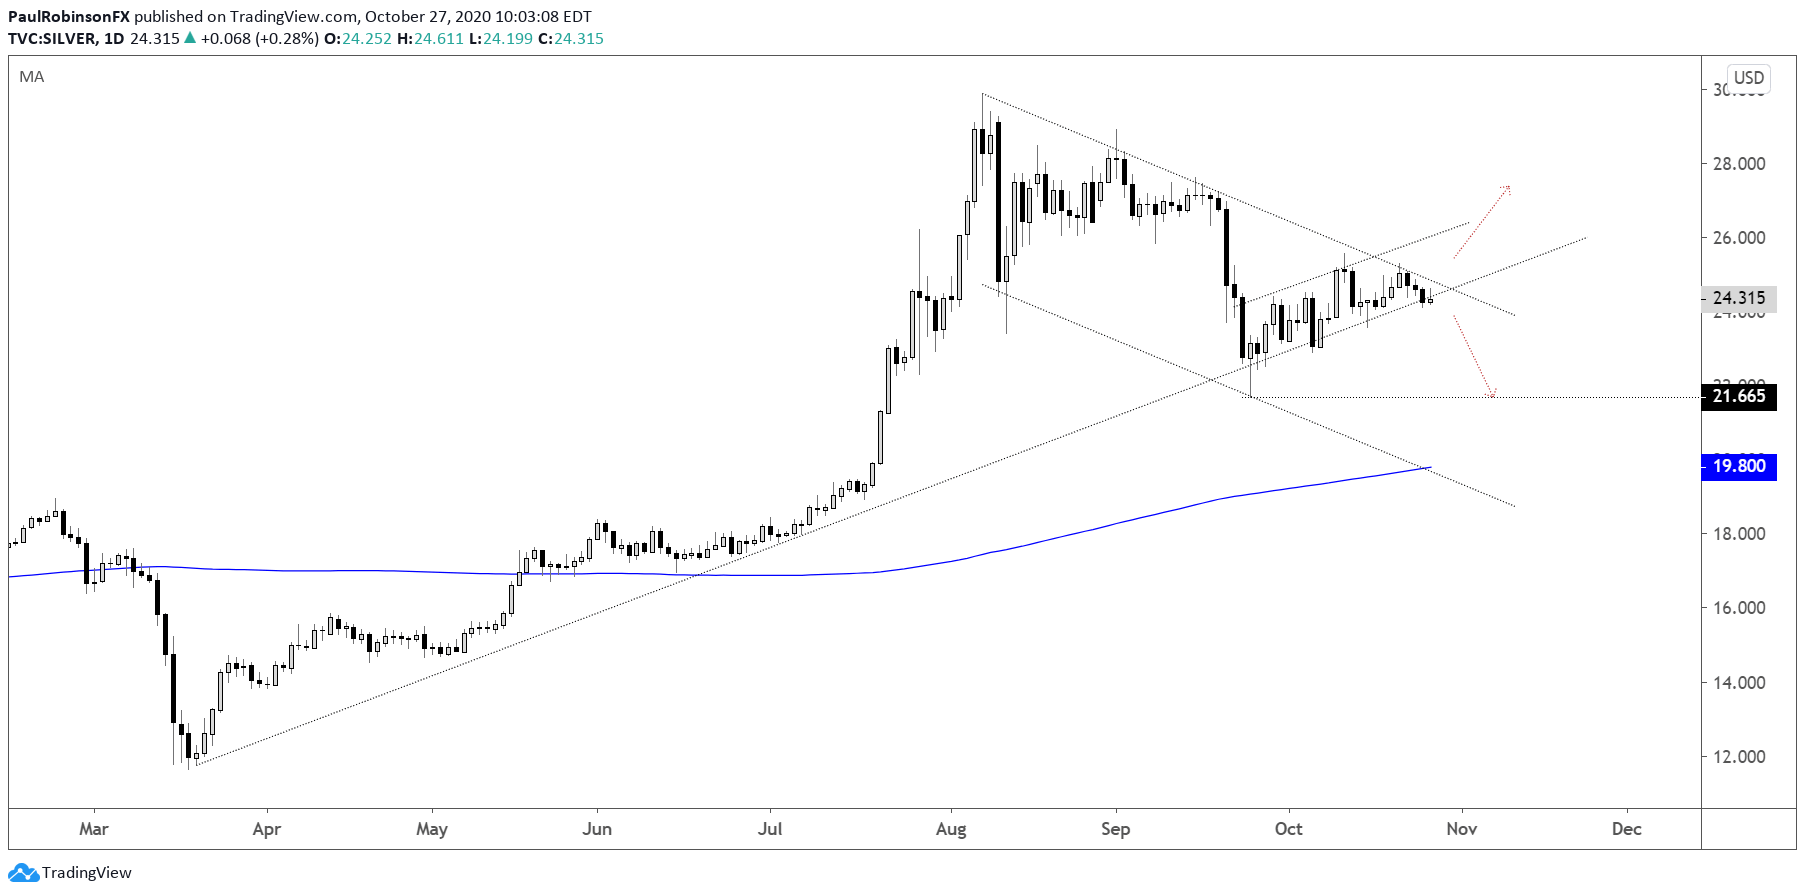
Silver priceaction is interesting at the moment because of the trend-line it continues to further validate as important. The line rising up from the March low has received a lot of attention over the past month. With silver stuck under trend-line resistance off the August high we are arriving at a make-or-break point here.

Silver Daily Chart (March trend-line)
For all the charts we looked at, check out the video above…
Resources for Forex Traders
Whether you are a new or an experienced trader, DailyFX has several resources available to help you; indicator for tracking trader sentiment, quarterly trading forecasts, analytical and educational webinars held daily, and trading guides to help you improve trading performance.
---Written by Paul Robinson, Market Analyst
You can follow Paul on Twitter at @PaulRobinsonFX


