


Silver Outlook:
- XAG/USD Stalls in Anticipation of Stimulus Outcome
- CCI Nears Overbought Territory
- Silver trades above 50 period MA, for now
Visit the DailyFX Educational Center to discover why news events are Key to Forex Fundamental Analysis
Price Action Stalls as Stimulus Talks Continue
Renewed hopes of additional US stimulus combined with economic uncertainty increased the demand for Gold, Silver and other safe-haven assets temporarily, before retracing back into its rangebound state.
From a long-term perspective, the monthly chart below highlights how the Fibonacci levels from the historical move (taken from September 2008 low to March 2011 high) have formed support and resistance for the precious metal, forming areas of confluency for price action since recovering from March 2020 lows, which marks the low of the second Fibonacci (purple), with the high marked at 2983.9 (7 August 2020 high).
Silver Monthly Chart
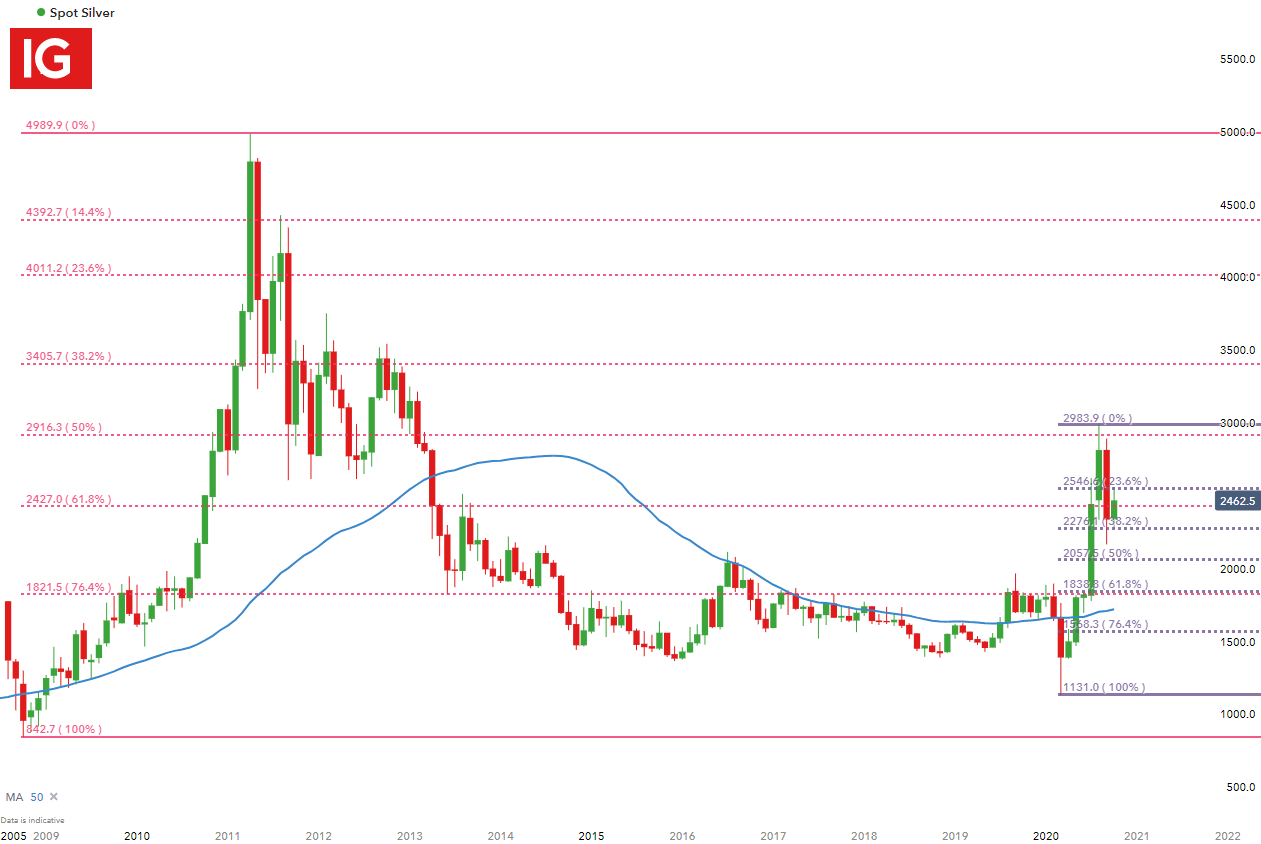
Chart prepared by Tammy Da Costa, IG
CCI Approaches Overbought Territory
For those focused on short-term moves, the Commodity Channel Index (CCI), which measures the price of an asset in comparison to its average over a certain period of time, is approaching 100, a possible indication that the price of silver may be entering into overbought territory. Meanwhile, prices are trading just above the 50-period Moving Average (MA).
Silver 4 Hour Chart
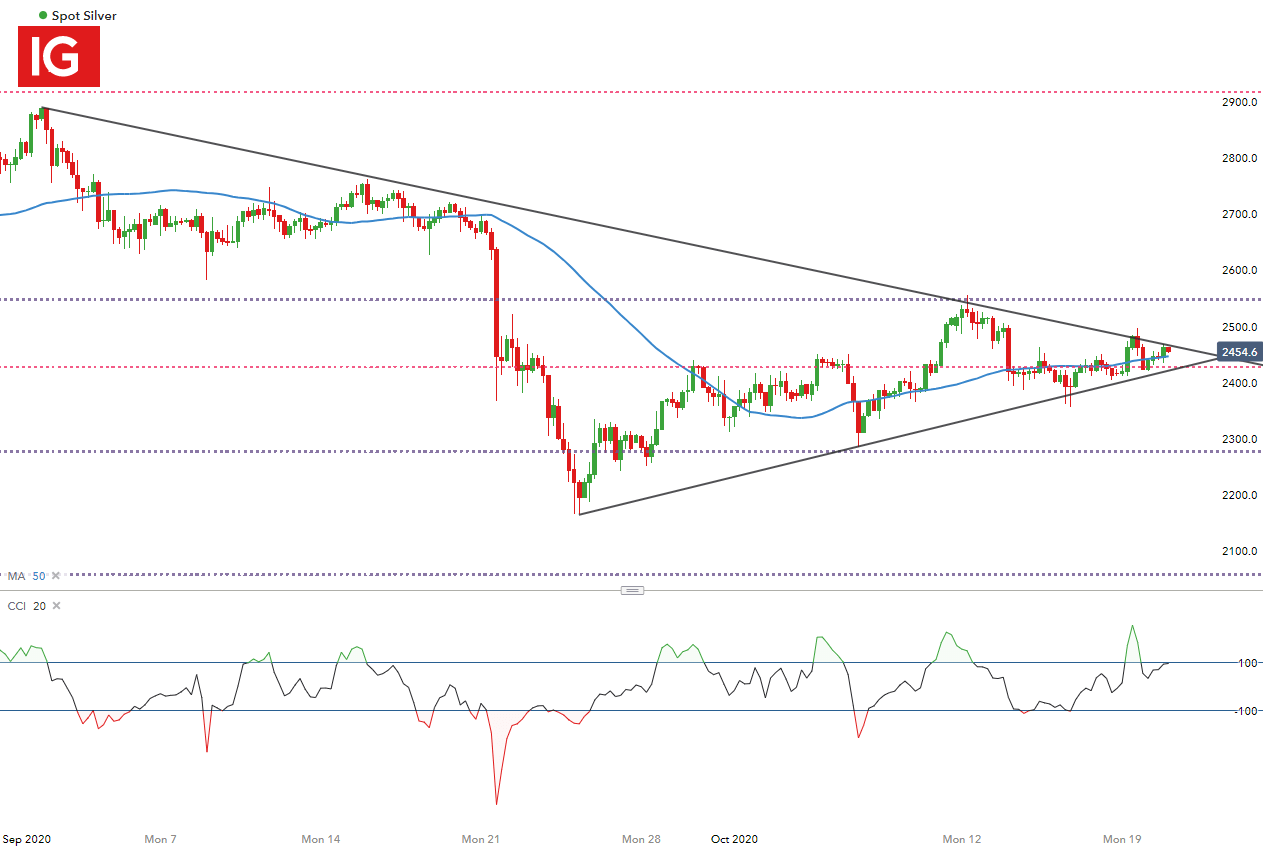
Chart prepared by Tammy Da Costa, IG
Silver Strategy Moving Forward
For now, the 61.8% Fibonacci retracement of the historical move continues to hold as support at 2427, with a break below possibly bringing the 38.2% retracement level of the short-term move into play at 2276.1.

On the opposite end, the 23.6% retracement level of the short-term move holds as resistance at 2546, with the next level of resistance holding at the psychological level of 2600.
--- Written by Tammy Da Costa, Market Writer for DailyFX.com
Contact and follow Tammy on Twitter: @Tams707


