


Australian Dollar, China Q3 GDP, IMF World Economic Outlook, Australia-China Trade Tensions:
- Upcoming economic data out of China could fuel the Australian Dollar’s push to retest its yearly high.
- However, deteriorating Australia-China relations threatens to fuel a period of significant risk aversion.
IMF Forecast China to Lead Global Economic Recovery
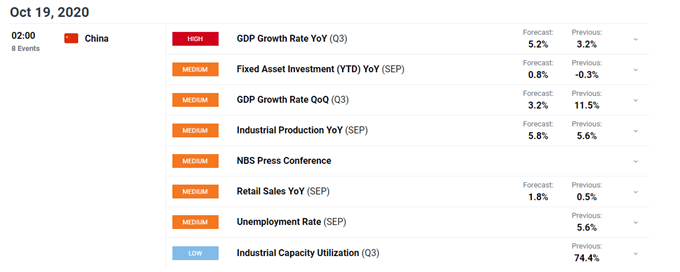
Fresh data prints coming out of China may sway AUD/USD, as Australia’s largest trading partner is expected to grow 5.5% in the third quarter of 2020.
Should this expansionary print come to pass, it would show that the Chinese economy has recovered all lost ground from its record 6.8% contraction in the first quarter and continues to lead the global economic rebound from the coronavirus-induced doldrums.
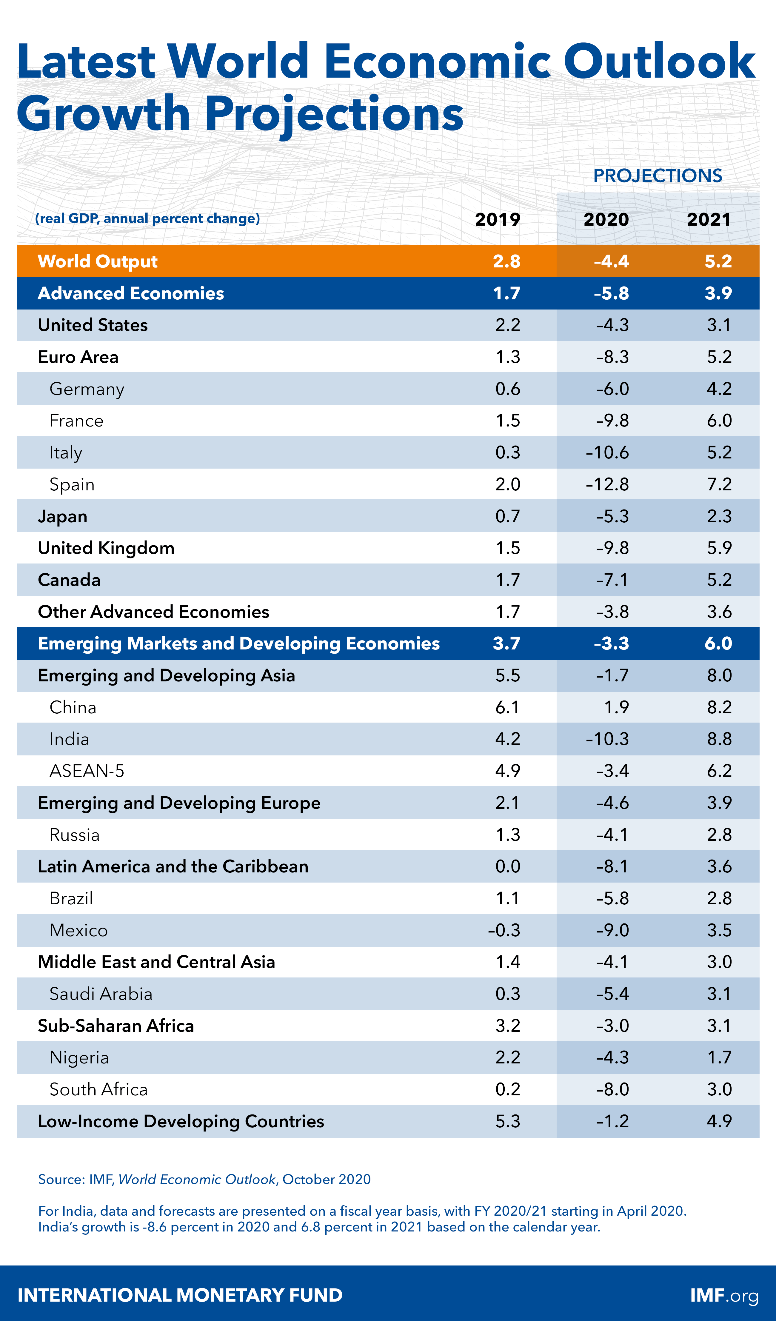
In fact, the International Monetary Fund’s (IMF) latest projections indicate that China is the only major nation expected to grow this year, on the back of a surge in export demand and its success in containing the outbreak of the highly infectious coronavirus.
Moreover, the Chinese government has yet to unleash trillions of yuan in stimulus, after selling a record amount of bonds this year, which suggests that a more extensive recovery could be in the offing.
Beijing has ordered regional governments to sell 3.75 trillion yuan of bonds by the end of October, building on the 2.27 trillion already issued by the end of July and surpassing the total amount of debt issued in 2019.
Therefore, with a substantial fiscal stimulus safety-net in place it appears the world’s second-largest economy is set to continue expanding this year, which may ultimately buoy regional risk appetite and in turn put a premium on the cyclically-sensitive Australian Dollar.

Australia-China Tensions Limiting AUD
However, escalating tensions with China may hamper the trade-sensitive AUD, after two Australian cotton industry groups released a joint statement stating that “it has become clear to our industry that the National Development Reform Commission in China has recently been discouraging their country’s spinning mills from using Australian cotton”.
These measures are the latest in a tit-for-tat exchange that has seen Australia’s largest trading partner impose 80% tariffs on barley exports, launch an anti-dumping and anti-subsidy probe into the country’s wine, and verbally ban imports of Australian thermal and coking coal.
Given China accounts for 40% of Australia’s exports, a marked deterioration in relations would have devastating consequences for the local economy and could possibly lead to $80 billion worth of iron ore exports falling into the Asian powerhouse’s crosshairs.
To that end, the development of this pivotal relationship should be intently watched by market participants, with a notable escalation in trade-based actions more than likely fuelling a period of risk aversion and in turn hampering the performance of the Australian Dollar.
Australia Exports by Country
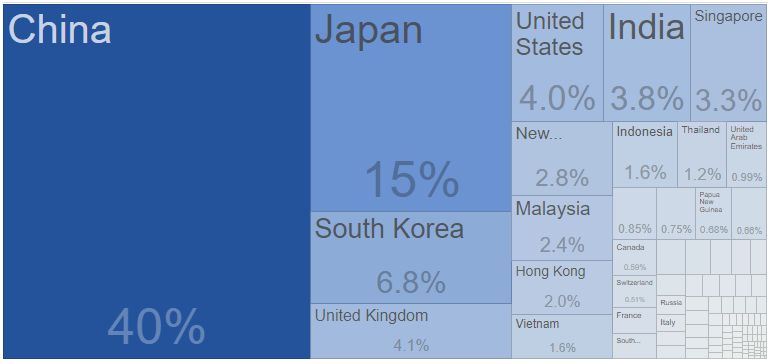
Source – Trading Economics
AUD/USD Daily Chart – 100-DMA Nurturing Rebound
From a technical perspective, the AUD/USD exchange rate seems poised to climb higher despite collapsing through Ascending Channel support and the pivotal 61.8% Fibonacci (0.7131), as price remains constructively perched above the 100-day moving average (0.7059).
With AUD/USD carving out a Bull Flag formation just above key support and the RSI eyeing a cross back above its neutral midpoint, the path of least resistance seems skewed to the topside.
A daily close back above the 61.8% Fibonacci (0.7131) would probably generate a retest of the monthly high (0.7243), with a break and close above the 0.7250 mark needed to carve a path to test the September high (0.7413).
Conversely, a break below the 100-DMA (0.7059) could ignite a more extensive pullback and bring key psychological support at the 0.7000 level into focus.
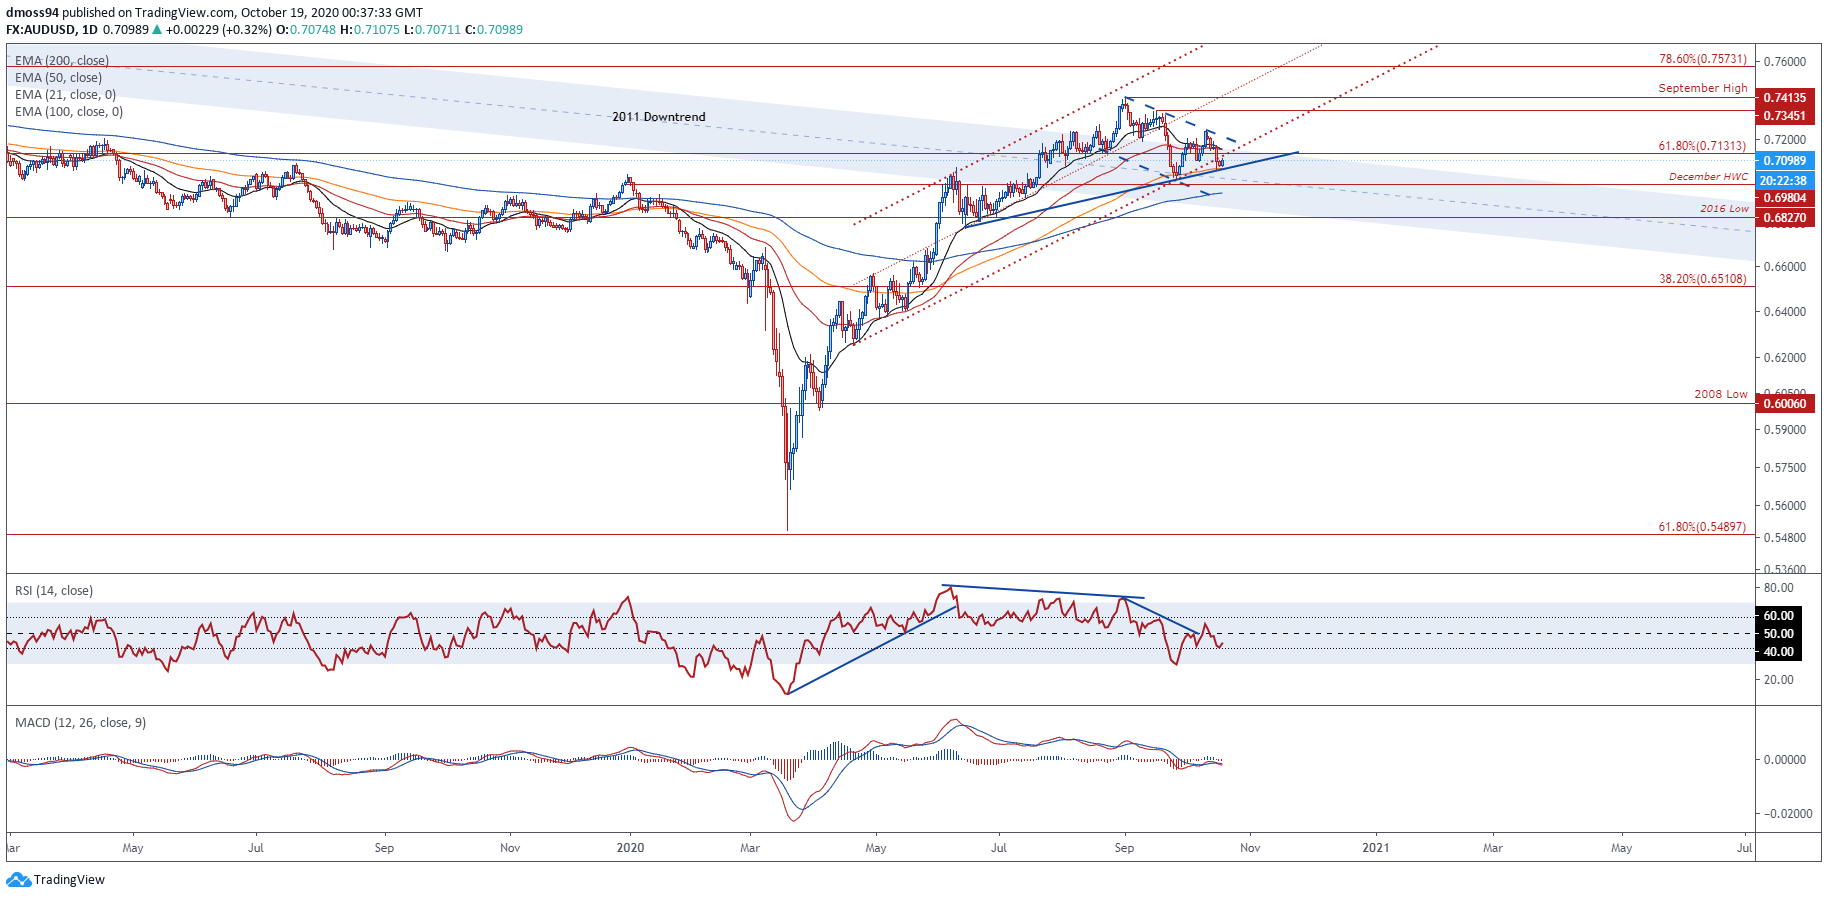
AUD/USD daily chart created using TradingView
-- Written by Daniel Moss, Analyst for DailyFX
Follow me on Twitter @DanielGMoss


