


USD/ZAR Outlook:
- USD/ZAR faces Political pressure from both sides
- Price Action remains confined to key Fibonacci levels
- Stochastic nears 20 after crossing from above
- Visit the DailyFX Educational Center to discover why news events are Key to Forex Fundamental Analysis
Political Pressure Intensifies
Although South Africa is still experiencing the first wave of the Coronavirus pandemic, the emerging market, which was already in a recession prior to the pandemic, is struggling to recover and regain investor confidence. Following on from Cyril Ramaphosa’s unveiling of an economic recovery plan yesterday, the market reaction reiterated the fact that investors are losing confident in the government’s ability to carry out these plans. While income disparities and political instability are additional factors to consider, it appears as if South Africa’s road ahead is definitely not going to be an easy one.
Meanwhile, with only 18 days to go until the US presidential elections, the uncertainty around additional stimulus is raising concerns regarding the economy’s ability to recover.
USD/ZAR Remains Confined to Key Fibonacci Levels
From a technical standpoint, the weekly chart below highlights how the Fibonacci retracement levels (From 30 Dec 2019 low to 6 April 2020 high), have formed support and resistance levels for the pair, with price action trading in an area of confluency between these levels.
Currently, price action appears to be confined by the 50% retracement level of this move at 16.64, holding both bulls and bears at bay.
USD/ZAR Weekly Chart

Chart prepared by Tammy Da Costa, IG
Stochastic Nears Oversold Territory
From a short-term perspective, the four hour chart below now highlights the stochastic nearing oversold territory after crossing the 80 mark from above. Should it fall below 20, this may be a possible indication that the trend may reverse towards the upside or that the downward trend may be losing momentum, at least in the short term.

USD/ZAR Four Hour Chart
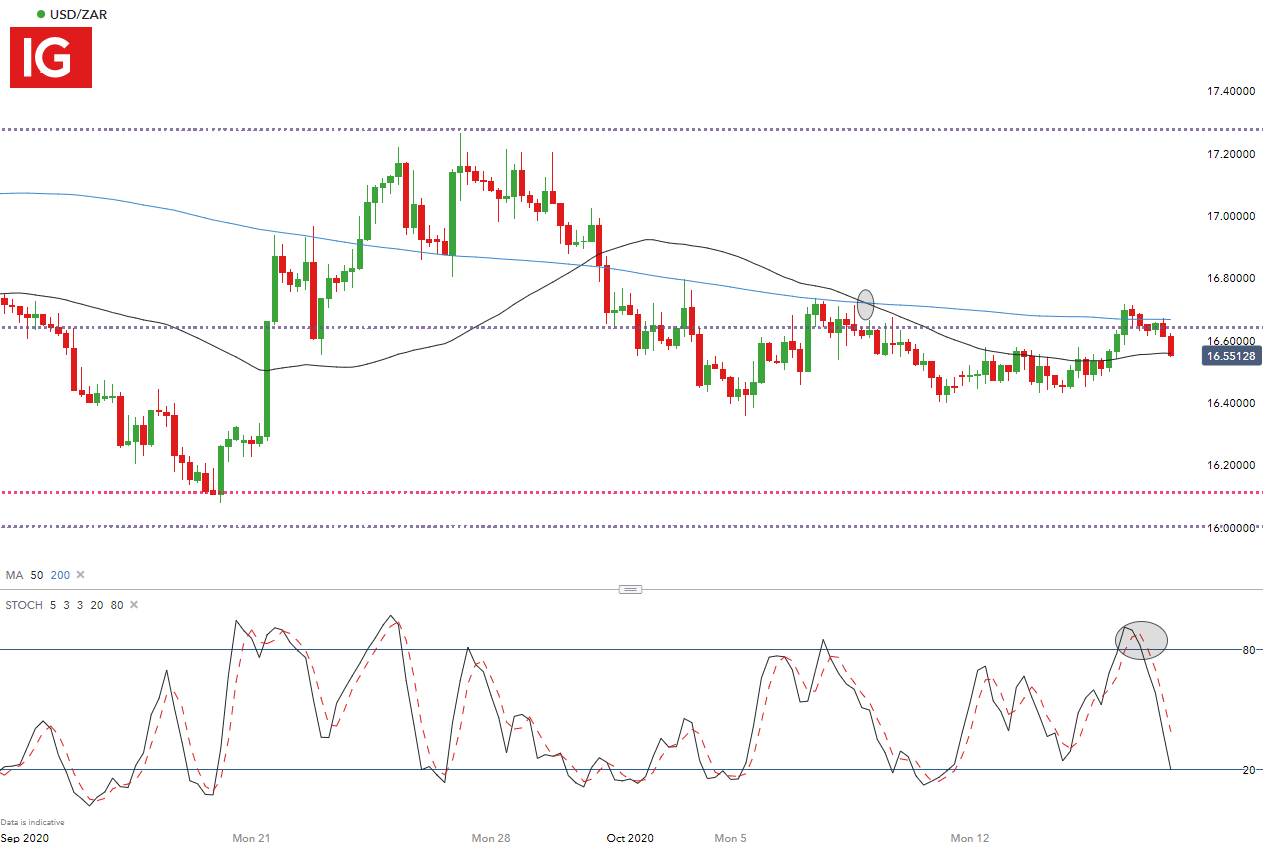
Chart prepared by Tammy Da Costa, IG
USD/ZAR Strategy Ahead
As long as price action remains above 16.50, the 50% Fibonacci retracement remains as resistance at 16.65. If this level is broken, further upside may prevail with the next resistance level around the psychological level of 17.00.
On the other hand, a break below may push price action towards the next level of support at 16.10, the 23.6% retracement of the long-term move.
--- Written by Tammy Da Costa, Market Writer for DailyFX.com
Contact and follow Tammy on Twitter: @Tams707


