


GBP price, Brexit news and FTSE analysis:
- EU leaders are beginning a two-day meeting of the European Council today, with the post-Brexit relationship between the EU and the UK on the agenda.
- Trading in both GBP and the FTSE will likely be choppy as headlines emerge from the meeting suggesting progress, or the lack of it, in the EU-UK trade talks.
GBP/USD and FTSE at mercy of EU-UK trade headlines
EU leaders are gathering in Brussels today for a two-day meeting of the European Council, with the post-Brexit relationship between the EU and the UK the second item on the agenda after a discussion of the Covid-19 pandemic.
With no agreement on trade yet reached, both GBP and the FTSE 100 index of the leading London-listed stocks will likely be buffeted for the rest of the week by headlines suggesting the EU and the UK are moving closer together or further apart.
That means trading will likely be choppy as the EU leaders debate whether progress is being made and the UK Government then decides how to respond now Prime Minister Boris Johnson’s deadline of October 15, today, has passed without a trade deal.
GBP/USD Price Chart, Daily Timeframe (July 15 – October 15, 2020)
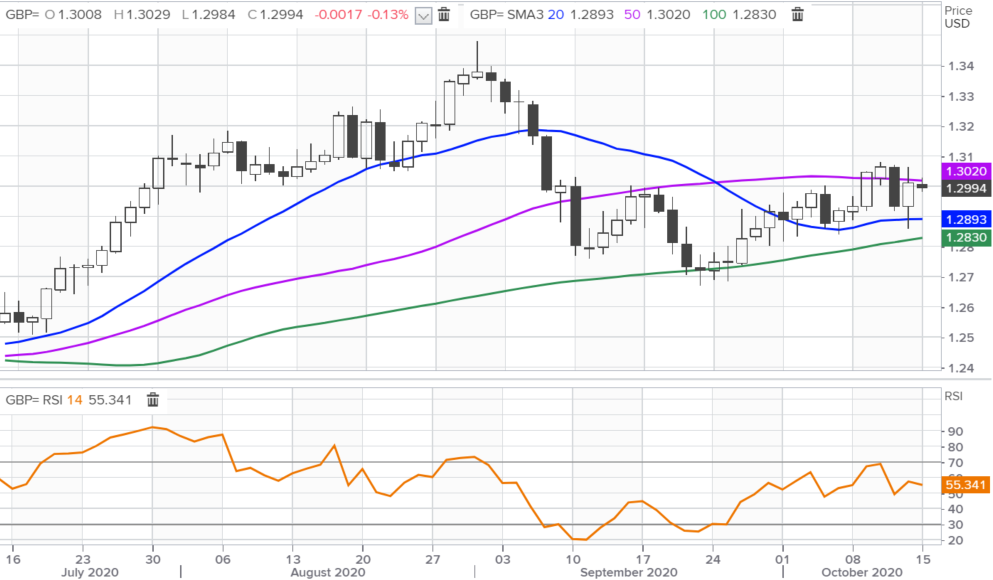
Source: Refinitiv (You can click on it for a larger image)

For now, the two sides remain far apart on issues such as fisheries, fair competition and dispute resolution that need to be agreed before the current Brexit implementation period ends on December 31. However, it still seems likely that the EU and the UK will eventually reach a skeleton agreement, with the details to be worked out later.
In the meantime, both GBP/USD and the FTSE 100 could be held back by a move into safe-haven assets such as the US Dollar on the current resurgence of Covid-19 cases and fading hopes of a US fiscal stimulus package.
For GBP/USD, the key levels to watch on the upside are the highs of 1.3082 and 1.3072 reached on October 12 and October 13 respectively. To the downside the key support levels are 1.2893 from the 20-day moving average and 1.2830 from the 100-dma.
No sign of respite for the FTSE 100
Meanwhile, the FTSE 100 stock index remains under strong downward pressure. It was another 1.8% lower in early London trading today – its fourth successive daily fall. Here, the key levels to watch are the lows of 5,779 and 5,805 touched on September 21 and September 24. Note that the price is now well below the 100-dma, the 50-dma and the 20-dma, although the 14-day relative strength index (RSI) is now under the oversold level at 29.07.
FTSE 100 Price Chart, Daily Timeframe (July 15 – October 15, 2020)
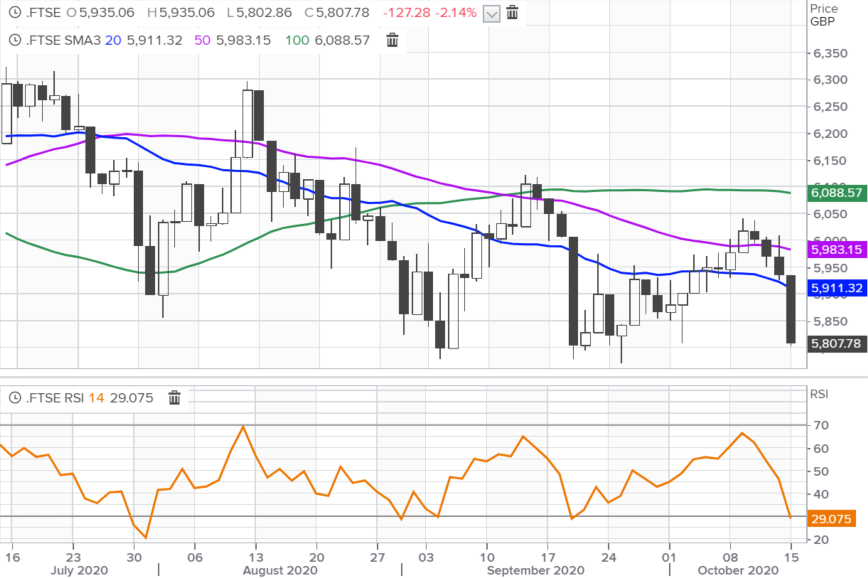
Source: Refinitiv (You can click on it for a larger image)
| Change in | Longs | Shorts | OI |
| Daily | -31% | 16% | -1% |
| Weekly | 12% | 0% | 3% |
We look at currencies and stocks regularly in the DailyFX Trading Global Markets Decoded podcasts that you can find here on Apple or wherever you go for your podcasts
--- Written by Martin Essex, Analyst
Feel free to contact me on Twitter @MartinSEssex


