


Nasdaq 100 Price Outlook:
- The Nasdaq 100 roared higher without a clear catalyst this week, only to consolidate around 12,100
- With earnings season kicking off this week and next, can the Nasdaq press higher still?
- Nasdaq Trading Basics: How to Trade Nasdaq 100
Nasdaq 100 Forecast: Tech Stock Rally Stops to Catch its Breath, What Next?
Resistance looked to keep the Nasdaq 100 in check last week as a technical barrier around the 11,570 mark loomed over the tech-heavy index. Evidently, the bullish break on Friday opened the door for a continuation higher and as the leader of speculative risk appetite, the Nasdaq accepted the challenge with glee. Subsequent gains were quick to follow as the Nasdaq charged more than 700 points - nearly 6% - higher in just two sessions.
Interestingly, the surge higher in tech stocks lacks an obvious catalyst. Traders, investors and analysts have attributed the climb to stimulus hopes, a “blue sweep” in November and optimism ahead of earnings season, while others have called it completely unfounded altogether. Regardless of the reason behind the rally, price has ascended far and fast and now trades just a few percentage points from its all-time high, but can the rally continue?
Nasdaq 100 Price Chart: 1 – Hour Time Frame (September 2020 – October 2020)
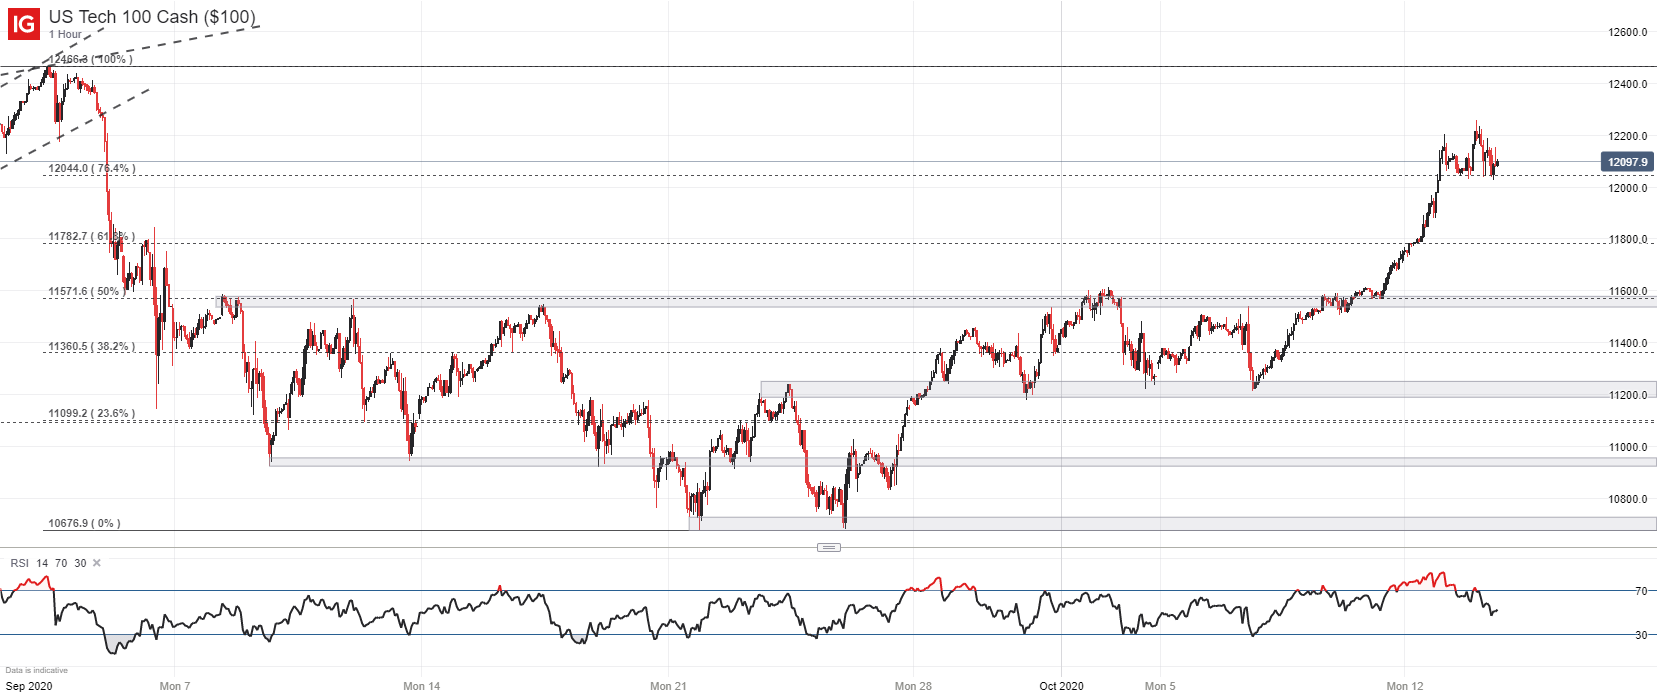
Well, suggesting weakness in the Nasdaq has seemingly become a fool’s errand as of late, as it continues to press higher time and time again, oftentimes devoid of fundamental catalysts. That said, mean reversion is an ever-present force and it is unlikely the Nasdaq 100 can press higher forever, despite its best efforts.
Therefore, while Tuesday’s price action serves as a pause to the recent rally, it begs the question whether the index will continue higher from here, or turn lower and consolidate further. Either way, employing nearby technical levels may provide assistance when looking to trade the volatile index. As it stands, the Fibonacci level around 12,045 may mark a nearby level of support that, if broken, could suggest the Nasdaq is vulnerable to a larger pullback.
Should further selling occur, secondary support may reside around the 11,800 level which was vaulted over during last Friday’s speed run higher. Tertiary support might be provided at 11,570, a level we previously highlighted as resistance.

If the pause proves only to be a momentary period of consolidation rather than a larger pullback, overhead resistance is rather sparse. Since the Nasdaq has blown through many prior barriers with ease, I would argue the next major technical level of note to the topside is the index’s all-time high at 12,466. In the meantime, follow @PeterHanksFX on Twitter for updates and analysis.
--Written by Peter Hanks, Strategist for DailyFX.com
Contact and follow Peter on Twitter @PeterHanksFX


