


Technical Outlook:
- GBP/USD breaking out above resistance
- EUR/USD rising in near-term channel formation
- DXY working lower towards big retest of long-term support
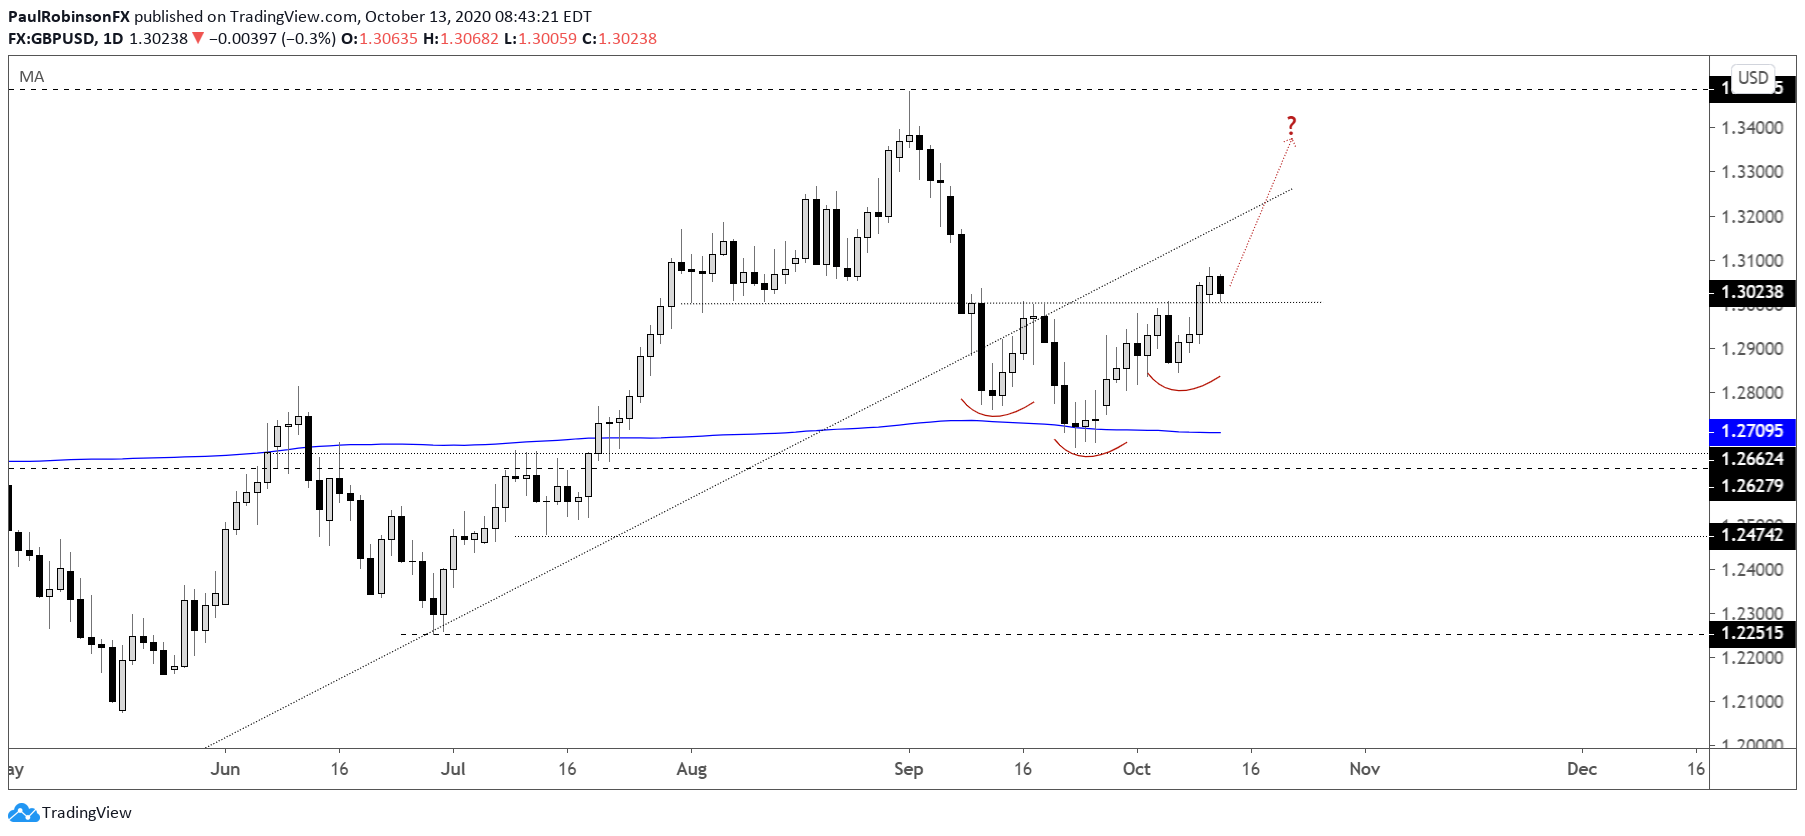
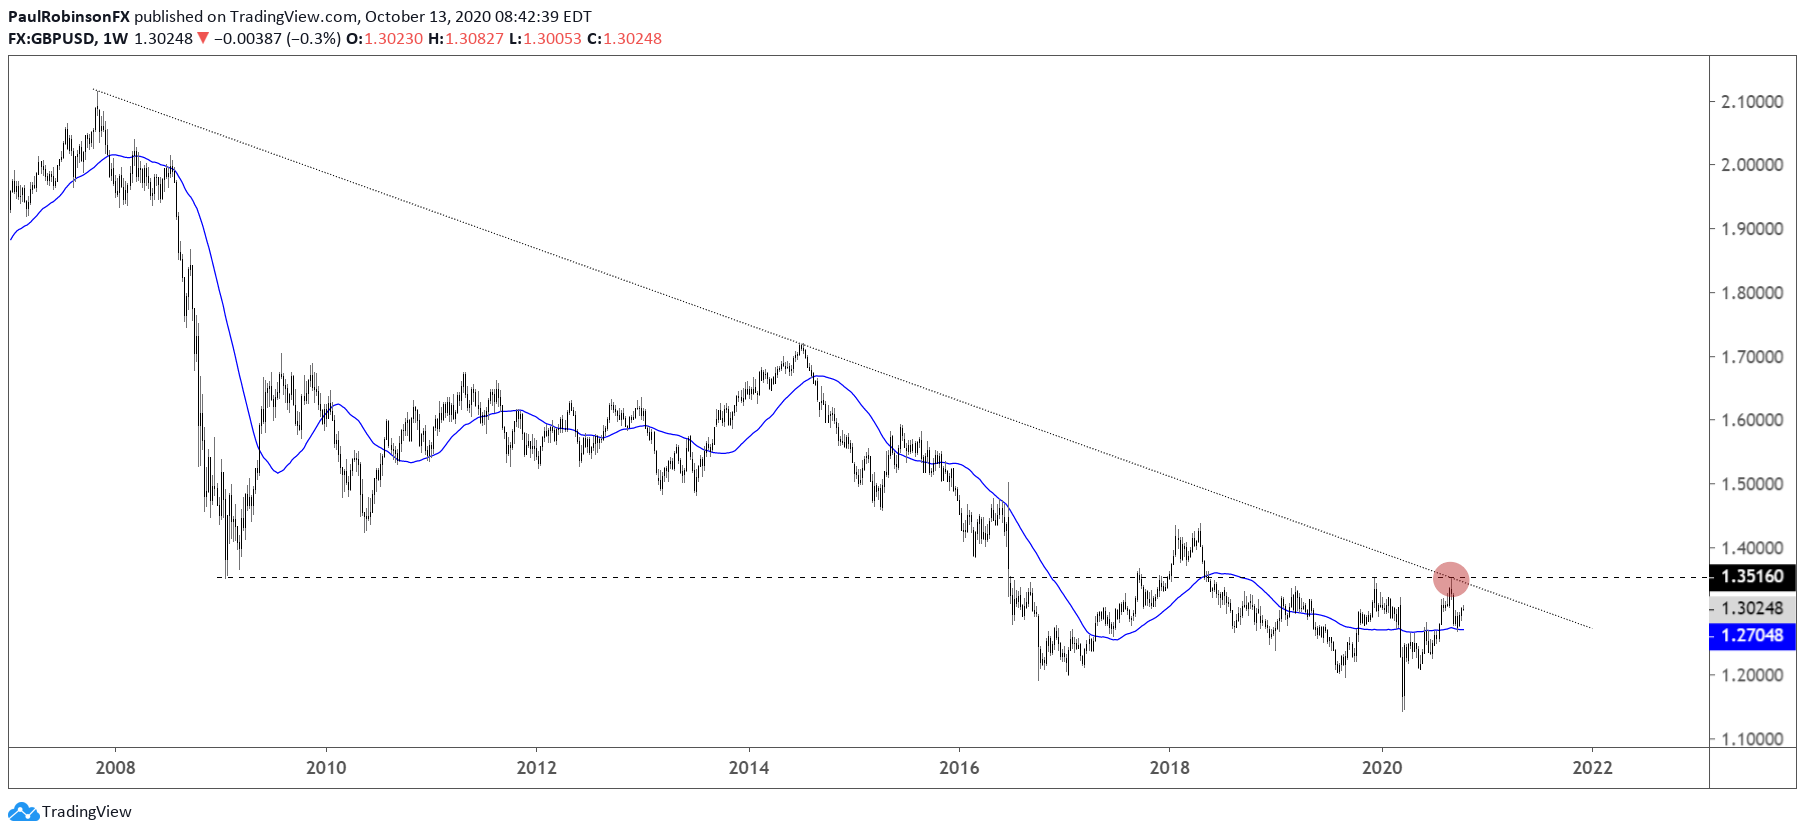
GBP/USD is doing its best to hold onto prior resistance turned support around the 13000 level, which also happens to be the neckline of an inverse head-and-shoulders (H&S) pattern. Maintain above support and we could see price swing back up towards the 2007 trend-line where the most recent high was near 13500.

GBP/USD Daily Chart (inverse H&S)
GBP/USD Weekly Chart (~13500 is a big spot)
EUR/USD is working its way higher in a near-term channel best seen on the 4-hr chart. Whether it can sustain, from a technical perspective, hinges on whether it stays in the channel or can break outside of it. To accelerate back towards 12000 or higher we will of course need to it to pick up steam out of the structure. A breakdown below the lower parallel could spell trouble as it may mark the end of corrective bounce that leads to a leg lower.

EUR/USD 4-hr Chart (rising in channel)

The US Dollar Index (DXY) is trading off towards a big level of support. It actually started as far back as 1998 and became a horizontal level that came in and out of play over the years. Most recently it helped forge a low along with the 2011 trend-line. The trend-line only has the bare minimum connecting points to make it a trend-line, but the fact that it has a parallel that has been in play numerous times in recent years helps strengthen it. 91.75 is ultimately the big level to watch to see whether the DXY can form a bottom, because if not we could be seeing the next wave of selling take the index down to 88.25, the 2018 low.
DXY Weekly Chart (big long-term support)

U.S. Dollar Currency Index (DXY) Chart by TradingView
For all the charts we looked at, check out the video above…
Resources for Forex Traders
Whether you are a new or an experienced trader, DailyFX has several resources available to help you; indicator for tracking trader sentiment, quarterly trading forecasts, analytical and educational webinars held daily, and trading guides to help you improve trading performance.
---Written by Paul Robinson, Market Analyst
You can follow Paul on Twitter at @PaulRobinsonFX


