


Gold (XAU/USD) Analysis, Price and Charts
- Lower highs highlight current weakness.
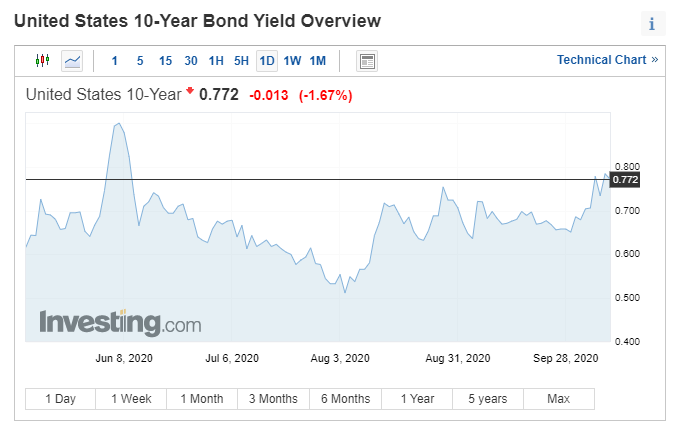
- US 10-year yield hits a multi-month high.
- IG client data hints at bullish sentiment.
Gold continues to flounder below the $1,900/oz. level as risk markets continue to run higher. A pick-up in longer-dated US Treasury nominal yields to near multi-month highs has helped turn US real yields less negative – the 10-year US real yield has tightened in from -1.10% to a current level of -0.90% - dampening the appeal of the precious metal. US bond yields are pushing higher on renewed hope of a fresh stimulus package, despite US President Trump seemingly taking this option off the table earlier this week. A series of targeted stimulus measures are now being discussed with a support package for the airline industry, small businesses and a potential $1,200 cash payment to the American public all mooted yesterday.

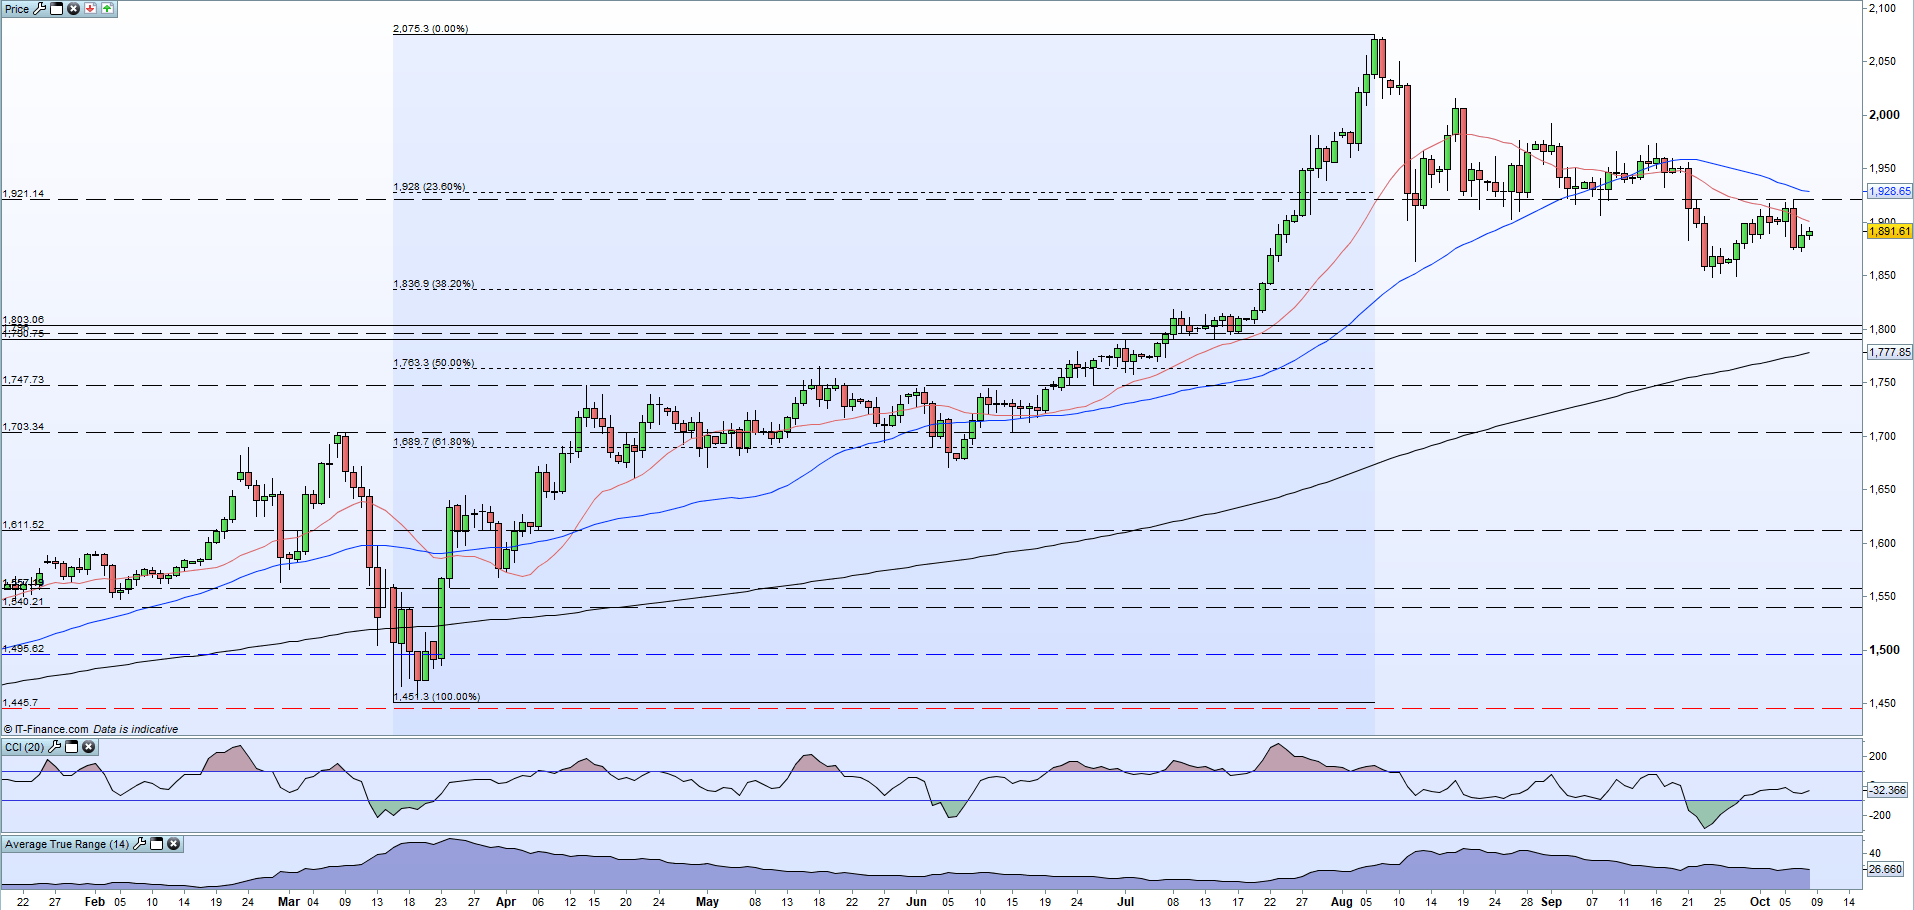
The daily chart shows a recent series of lower highs weighing on the price of gold and suggesting further falls ahead unless this series is broken. The precious metal will need to take out the recent $1,921/oz. high print to negate the current negative bias, before the 50-day simple moving average and the 38.2% Fib retracement around $1,928/oz. come into play. A further rejection of the 20-dma, currently at $1,901/0z. will leave recent lows just below $1,850/oz. vulnerable ahead of the 50% Fib retracement at $1,837/oz.
Gold Daily Price Chart (January – October 8, 2020)

IG client sentiment datashows 78.64% of traders are net-long with the ratio of traders long to short at 3.68 to 1.The number of traders net-long is 2.60% higher than yesterday and 2.39% lower from last week, while the number of traders net-short is 17.57% higher than yesterday and 13.23% higher from last week.We typically take a contrarian view to crowd sentiment, and the fact traders are net-long suggests Gold prices may continue to fall.
Yet traders are less net-long than yesterday and compared with last week. Recent changes in sentiment warn that the current gold price trend may soon reverse higher despite the fact traders remain net-long.
What is your view on Gold – are you bullish or bearish?? You can let us know via the form at the end of this piece or you can contact the author via Twitter @nickcawley1.


