


ASX 200 Index, RBA Interest Rate Decision, Australian Federal Budget – Talking Points:
- The RBA’s wait-and-see approach to monetary policy may weigh on regional asset prices.
- However, the Federal Government’s upcoming budget announcement could firm market sentiment.
- The ASX 200 index’s rebound could prove to be a mere short-term rebound. Are further losses in the offing?
Wait-and-See RBA Limiting ASX 200 Upside
The ASX 200 index’s rebound from psychological support at the 5700 level could prove to be a mere short-term correction, as the Reserve Bank of Australia is expected to keep its monetary policy settings unchanged at its upcoming meeting on October 6.
Although RBA Deputy Governor Guy Debelle appeared to suggest that the central bank could adjust its monetary policy levers in the coming months “given the outlook for inflation and employment is not consistent with the Bank’s objectives over the period ahead”, it seems relatively unlikely that this will eventuate ahead of the Australian Government’s update to the Federal Budget.
In fact, with Treasurer Josh Frydenberg announcing the simplification of the responsible lending laws imposed in the wake of the 2008 global financial crisis to ensure that “there are no unnecessary barriers to the flow of credit to households and small businesses”, the need for additional monetary stimulus may not be as dire as previously thought.
That being said, market participants seem to be positioning for a cut to the Official Cash Rate (OCR), with interbank cash rate futures showing a 67% chance that the central bank will take the OCR to 0% at the upcoming meeting.
Therefore, lack of any fundamental change to the RBA’s stance could lead to a marked discounting of the ASX 200 index.
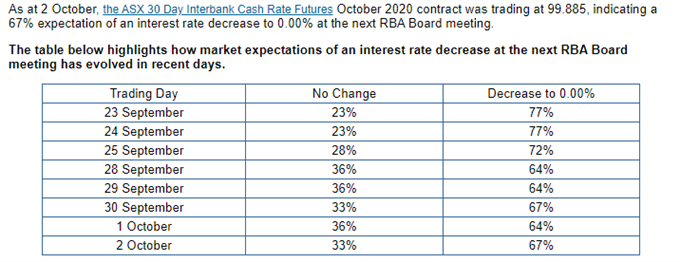
Source – ASX Rate Tracker

Stimulatory Budget Could Underpin Asset Prices
However, Josh Frydenberg’s suggestion that “in this budget you’ll see more economic activity as a result of our initiatives” could underpin regional asset prices, as the Treasurer prepares to announce updates to the Federal Government’s Budget just hours after the RBA rate decision on October 6.
Prime Minister Scott Morrison’s government is expected to bring forward tax cuts penned for 2022 and has already announced $7.5 billion in transport infrastructure spending.
Morrison stated that “we have been working closely with the state and territory governments to invest in the infrastructure that is ready to go and can help rebuild our economy and create more jobs”.
Moreover, Frydenberg committed to substantial government support until the unemployment rate is “comfortably under 6%”, adding that “obviously the deficit will be fairly significant, and the debt burden will increase, but this is the price of protecting lives and livelihoods”.
That being said, it remains to be seen if a stimulatory budget can counterbalance the lack of additional monetary support in the short-term.
Nevertheless, substantial fiscal support may shore up regional risk-sentiment in the interim and potentially buoy the ASX 200 index.
ASX 200 (XJO) Index Monthly Chart – Repeat of 2009?
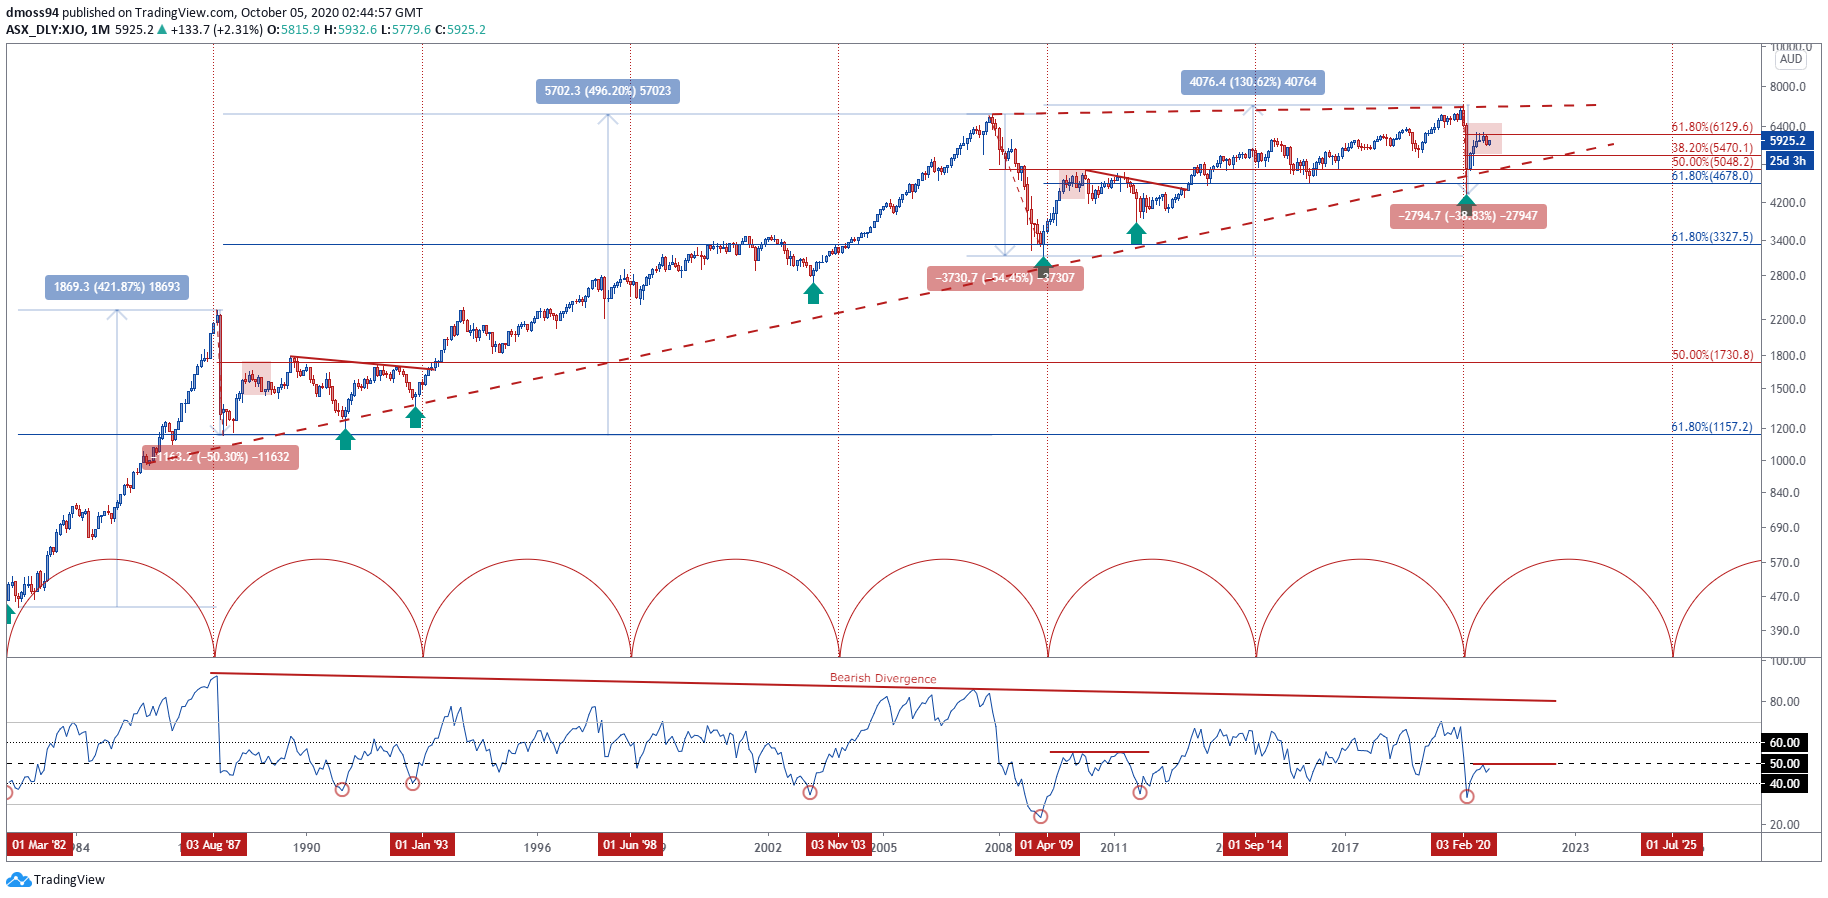
ASX 200 (XJO) Index monthly chart created using TradingView
Long-term analysis of the Australian benchmark ASX 200 index suggests that price may slide back towards confluent support at the 50% Fibonacci (5048.2) and uptrend extending from the 1986 low (974.8), if buyers remain unable to conquer key resistance at the 61.8% Fibonacci (6129.6).
The index’s recent rebound from the March low (4402.5) looks strikingly like what occurred in the fourth quarter of 1987 and 2009, in which the ASX 200 rallied 55.2% and 61% respectively before ultimately sliding over 25%, to end up down 48.1% and 45% from its record high at the time.
Moreover, the RSI’s struggles to break back above its neutral midpoint hints at fading bullish momentum and looks somewhat similar to the indicator’s developments throughout 2010, as price drifted lower from the April 2010 high (5025.1) to eventually bottom in August 2011 (3765.9).
Therefore, further declines could be in the offing if psychological resistance at the 6200 level continues to suppress bullish momentum, with a reversal back towards support at the 38.2% (5470.1), or even as deep as the 50% Fibonacci (5048.2), certainly not out of the question.
Conversely, a break back above the 6200 mark could invalidate bearish potential and facilitate a retest of the record high set in February (7197.2).
ASX 200 Index Daily Chart – 100-DMA Capping Upside

ASX 200 (XJO) Index daily chart created using TradingView
Zooming into a daily chart reinforces the bearish outlook depicted on the higher timeframes, as the ASX 200 continues to track below the sentiment-defining 200-day moving average (6032.29) and fails to break convincingly above psychological resistance at the 6000 level.
With the RSI confined by the downtrend extending from the June highs and the MACD indicator continuing to track firmly below its neutral midpoint, the path of least resistance looks to be lower.
A daily close below the 50% Fibonacci (5792.39) would probably signal the resumption of the primary downtrend and could see price push back towards the April high (5589.64), with a break below carving a path to test the 5000 mark.
On the other hand, a push back above the trend-defining 50-DMA (5994.70) could intensify buying pressure and bring the 23.6% Fibonacci (6235.63) into focus.
-- Written by Daniel Moss, Analyst for DailyFX
Follow me on Twitter @DanielGMoss


