


Technical Outlook:
- GBP/USD still pointed lower, at risk of another round of selling
- GBP/JPY to follow Sterling as the Yen remains largely inanimate
- DXY pulling back into support zone that could revitalize upside
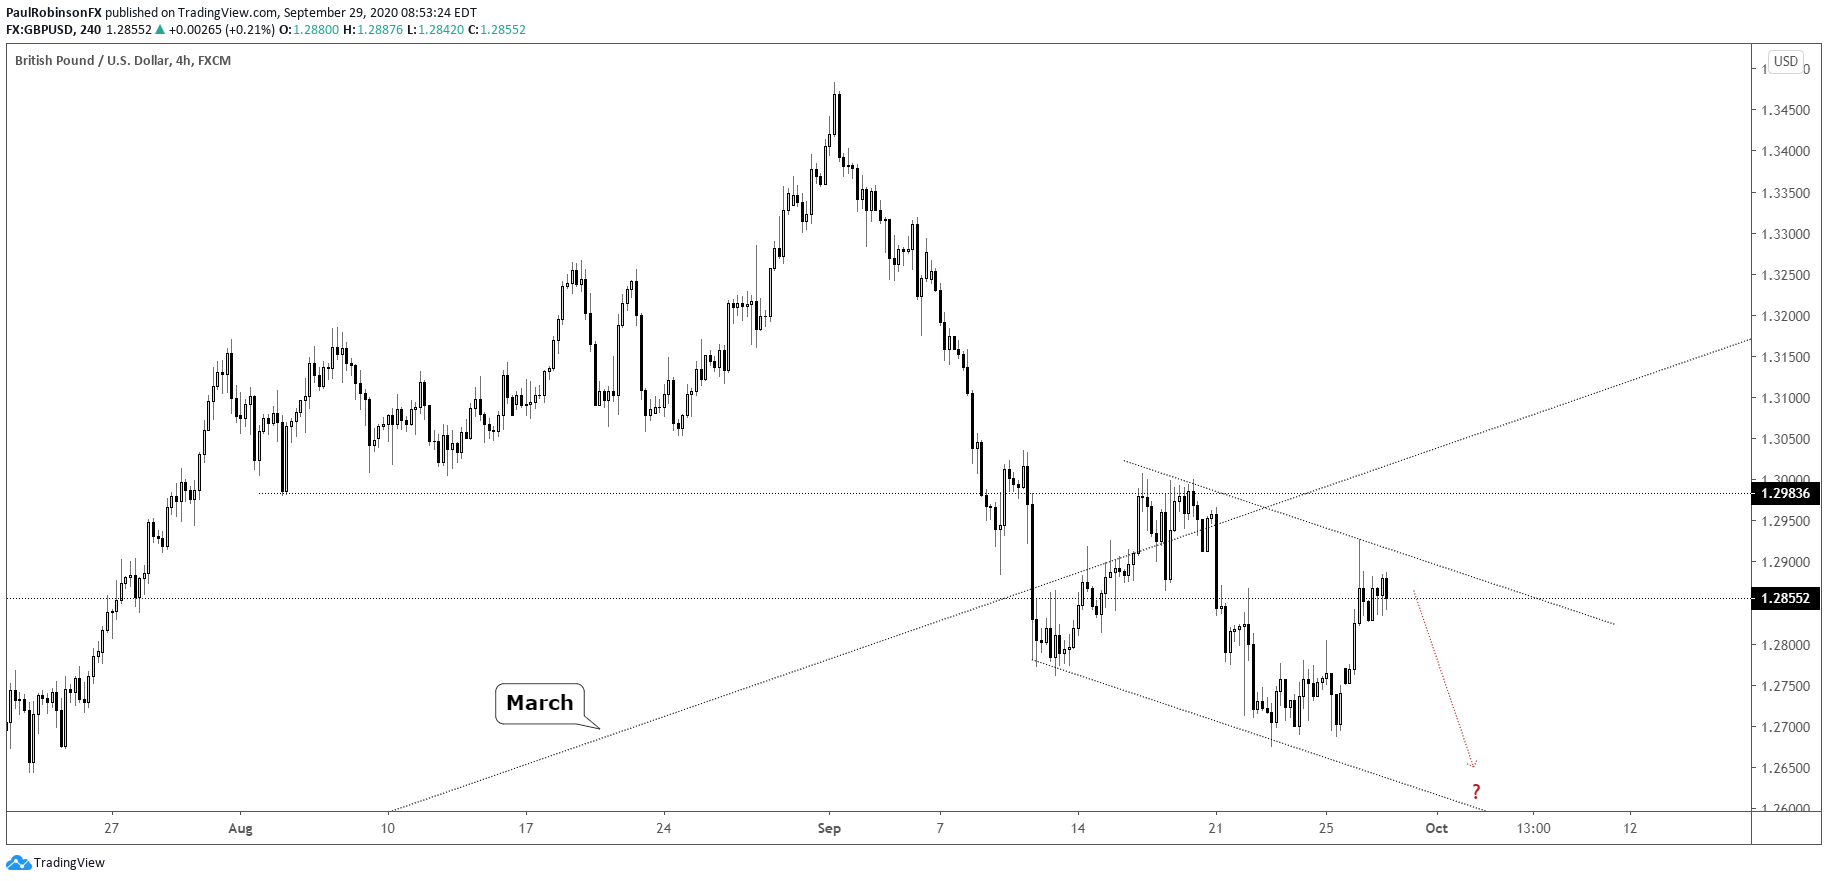
GBP/USD was putting together a strong rally yesterday, but fizzled and put price closing in the bottom half of its daily range. Turning to the 4-hr chart, it is still pretty clear there is a downtrend in place as per the lower highs and lower lows. With the lower and bottom-side trend-lines in parallel to one another we could be in the process of creating a channel structure that will act as a guide moving forward. For now, as long as yesterday’s high at 12930 isn’t breached the trading bias remains firmly lower. A breakout above doesn’t necessarily turn things bullish, as there is strong resistance near 13000, but it does help as the downtrend becomes less intact.

GBP/USD 4-hr Chart (pointed lower, channel could be forming)
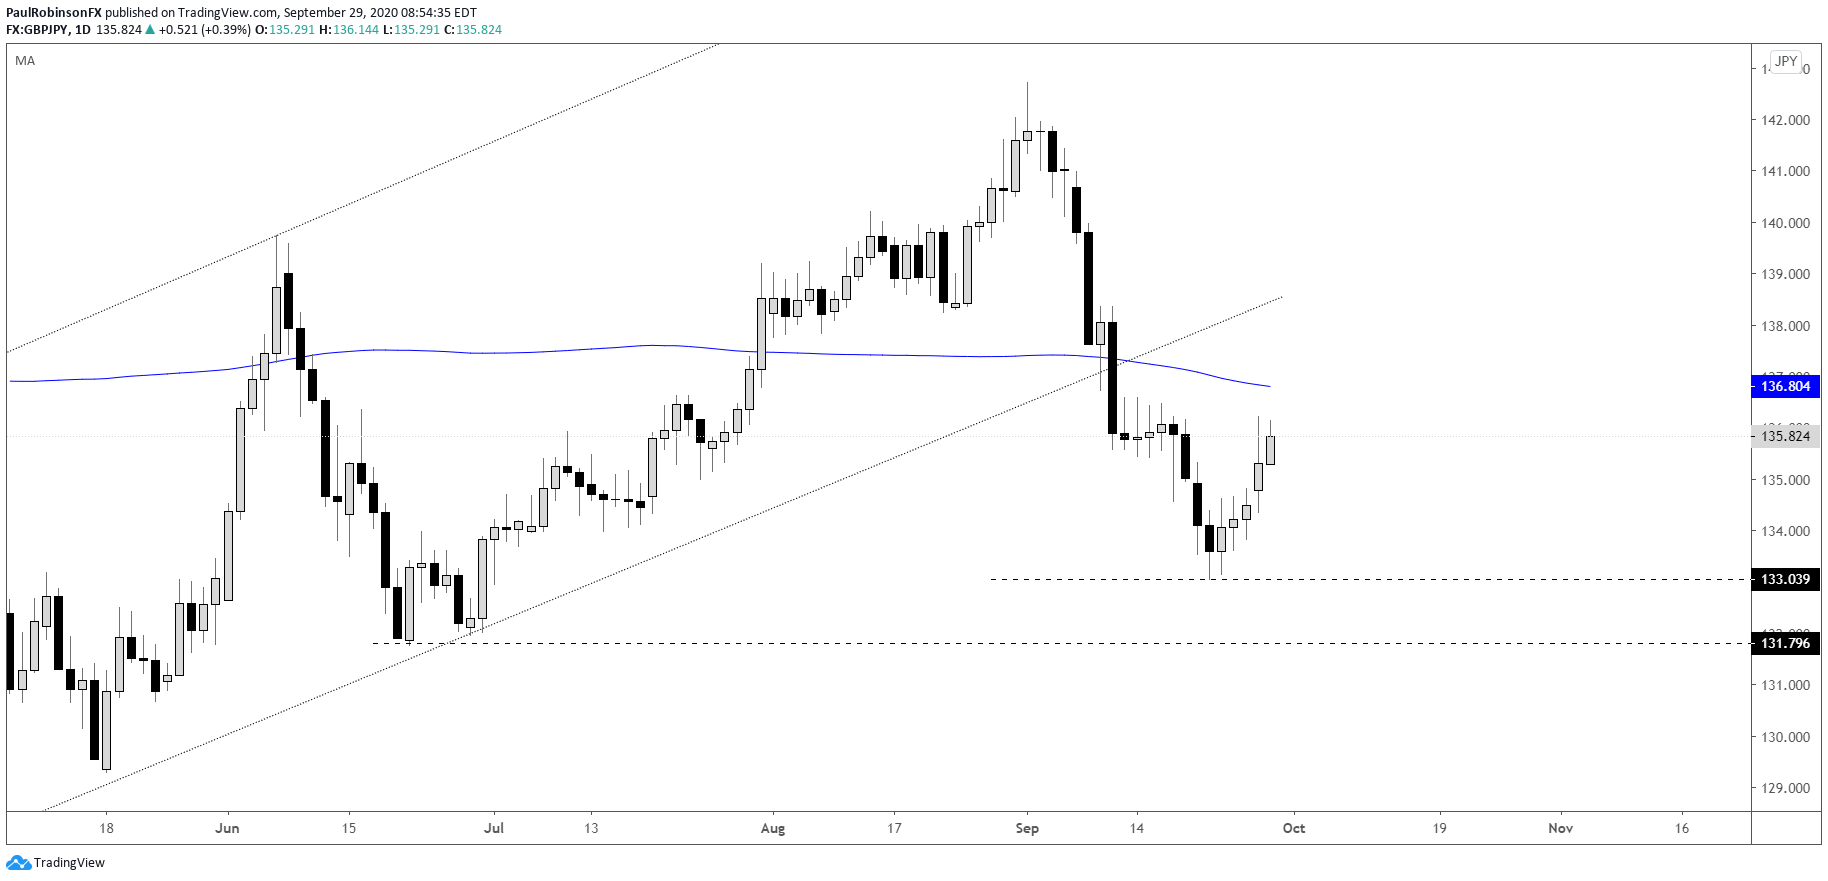
GBP/JPY is largely being run by Sterling in the absence of strong price in the Japanese Yen, and as such if Cable slips hard then it is likely this cross-rate will too. The downtrend structure isn’t as pronounce as is it in GBP/USD, but nevertheless it is weak. Another round of selling may bring the June low at 13175 into play.
GBP/JPY Daily Chart (another round of selling could be near)
The US Dollar Index (DXY)is retreating as we see broad USD weakness, but that could come to an end shortly if the 94/93.50-area holds as support. There is support there now as that previously acted as resistance. Generally speaking, looking for bullish set-ups within the short-term trend off of a very solid long-term support level. We have both the 2011 trend-line and the ~92 level that has been in play since as far back as 1998 as a meaningful swing point. If we are too see the DXY firm up again it should be shortly. Overcoming the March low (where we turned lower from this week) will be the next obstacle to overcome.
DXY Daily Chart (backing into support)

U.S. Dollar Currency Index (DXY) Chart by TradingView
For all the charts we looked at, check out the video above…
Resources for Forex Traders
Whether you are a new or an experienced trader, DailyFX has several resources available to help you; indicator for tracking trader sentiment, quarterly trading forecasts, analytical and educational webinars held daily, and trading guides to help you improve trading performance.
---Written by Paul Robinson, Market Analyst
You can follow Paul on Twitter at @PaulRobinsonFX


