


Nasdaq 100 Forecast for the Week Ahead:
- The Nasdaq 100 pushed higher to start the week after four consecutive weekly declines
- Encouragingly, stock market strength was quite broad with the financial and energy sectors leading
- Still, the tech-heavy index will have to weather an earnings report from Micron on Tuesday and jobs data due Friday
Why Did the Stock Market Rally Today? Nasdaq 100 Week Ahead
The Nasdaq 100 climbed 1.87% to start the week in a continuation of Friday’s charge as the index looks to conclude a 4-week slide. In a broad-based rally, typical winners like Apple and Microsoft were joined by the financial and energy sectors which topped sectoral performance in the S&P 500. While attributing the rally to a single catalyst is rather presumptuous, some analysts highlighted weekend discussions regarding another round of covid stimulus as a contributing factor.
Nasdaq 100 Price Chart: 1 – Hour Time Frame (August 2020 – September 2020)

While it is difficult to source the rally to a single event, a bullish break higher on the price chart is an encouraging development in pursuit of further gains. After gradually stepping lower since early September, the boisterous price action over the last two trading days has allowed the Nasdaq 100 to break above the upper bound of a descending trendline around 11,200.
That said, the technical level was a projection at best – enjoying only two points of contact – and more formidable resistance might reside slightly overhead near the 11,600 level which coincides with swing-highs established earlier this month. Either way, the technical picture will take cues from the fundamental landscape which will await the release of Micron earnings Tuesday and US jobs data Friday.
How to Value a Stock: A Trader’s Guide to Stock Valuation
As the first member of the semiconductor sector to report earnings each quarter, I sometimes liken Micron to a canary for the rest of the industry. Beleaguered by the US-China trade war, regulation regarding Huawei and cyclicality factors in its product offerings, Micron has juggled numerous concerns in recent reports and investors have taken note.
Nasdaq 100 Price Chart: Daily Time Frame (January 2020 – September 2020)
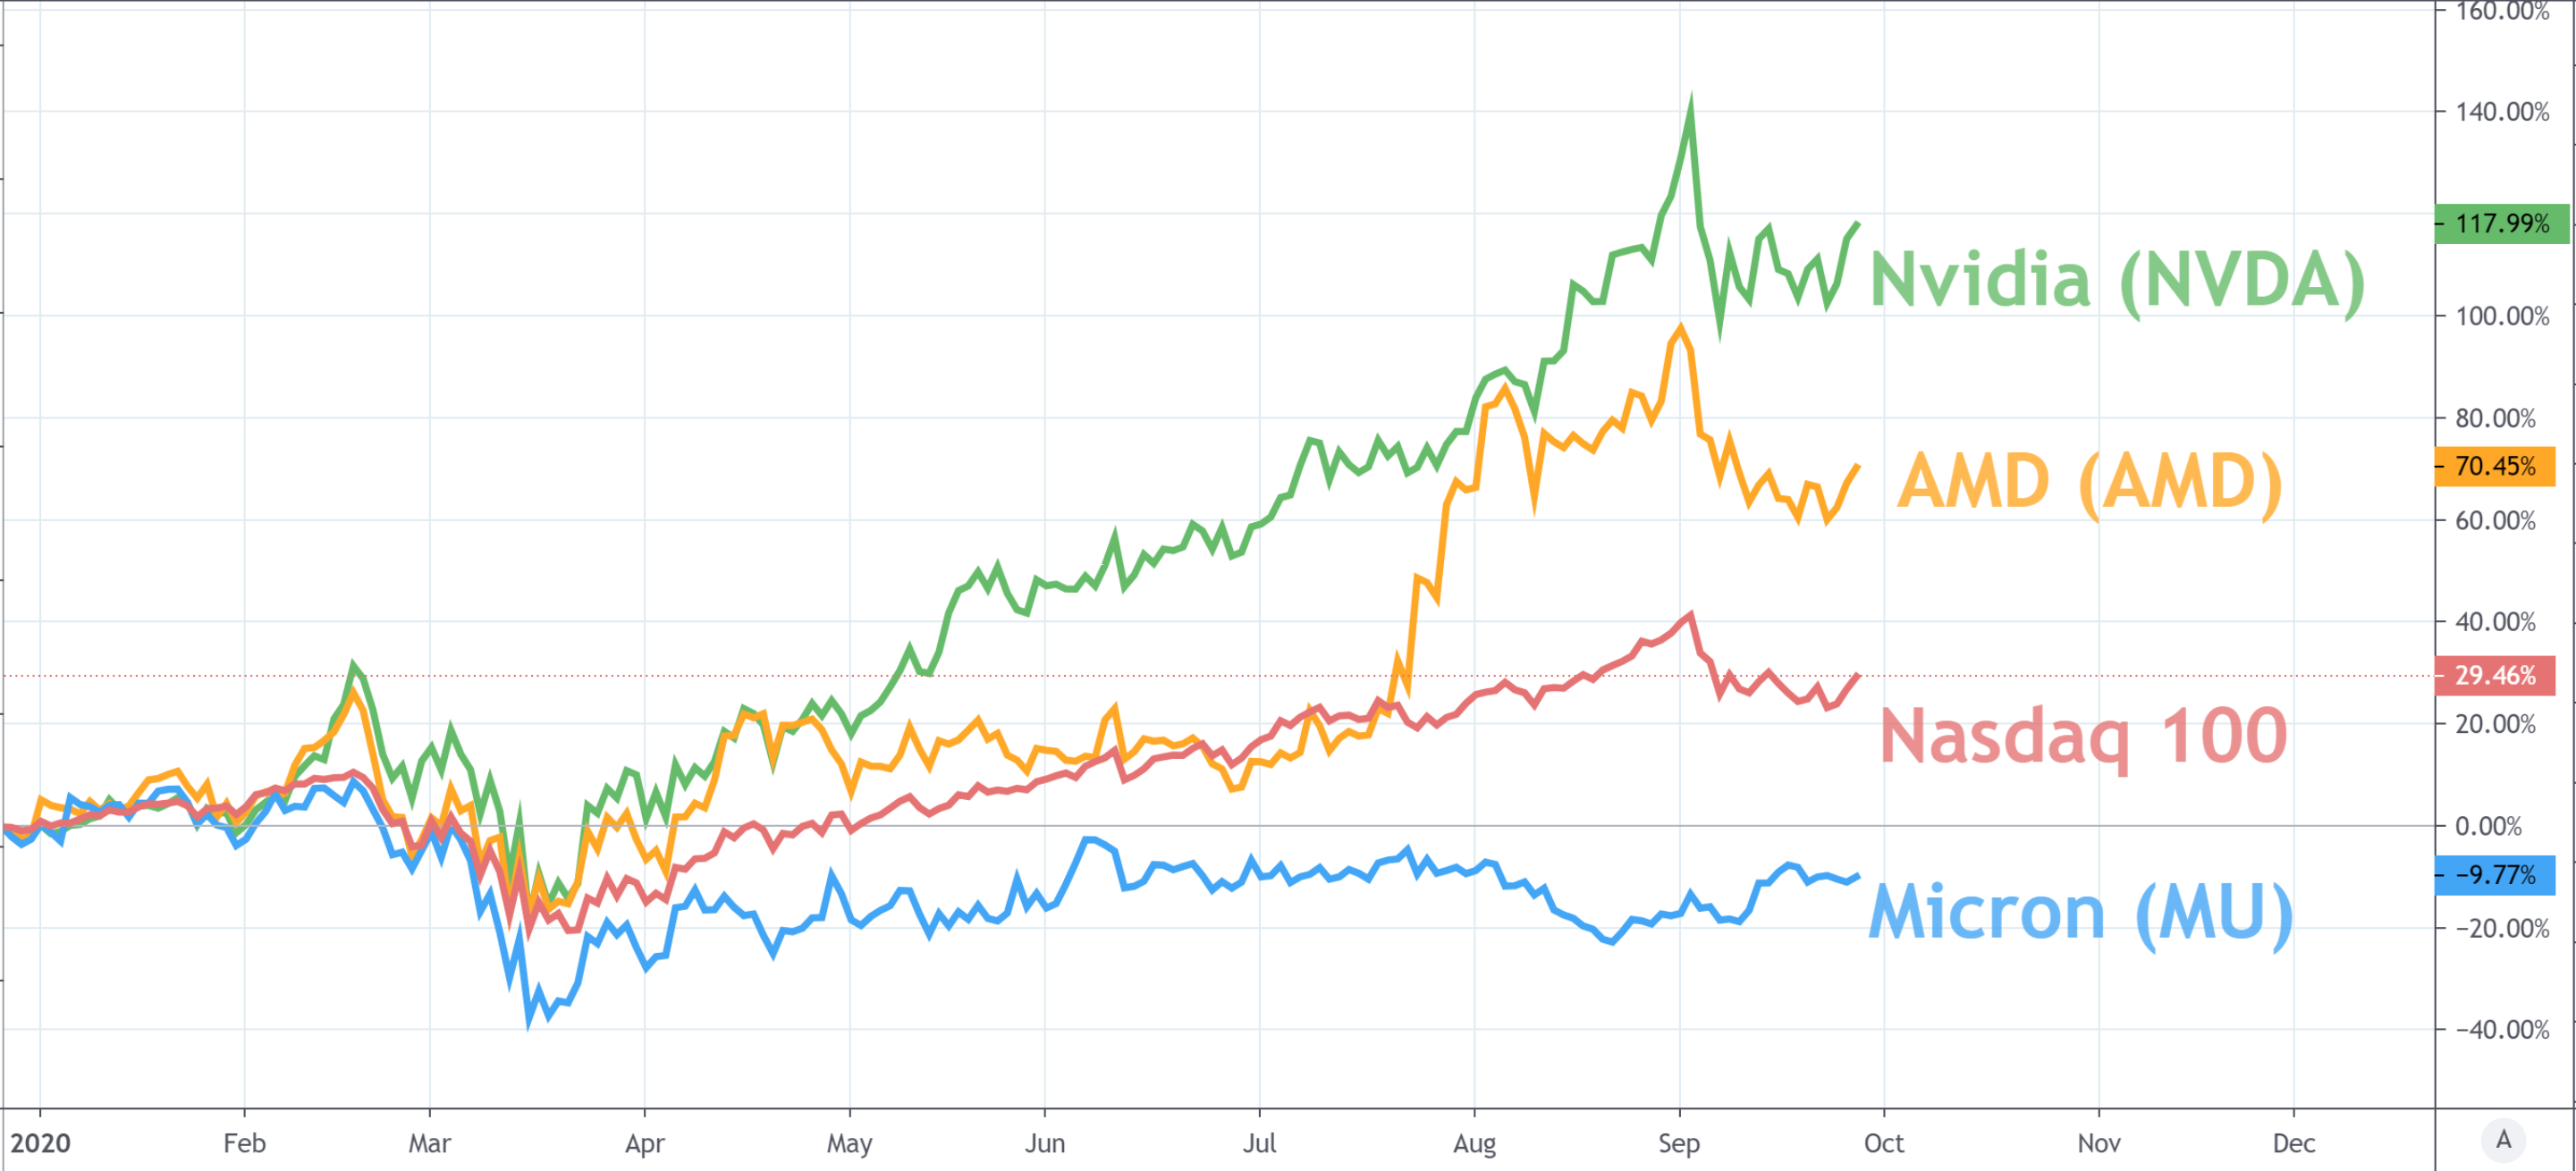
As a result, the stock is a laggard among its peers but its ability to offer insight into sectoral trends should not go unnoticed. Thus, Nasdaq 100 traders will likely keep a keen eye out for takeaways from the report due Tuesday afternoon as it could distort broader Nasdaq price action heading into the latter half of the week. Following Micron, the US non-farm payrolls report should grab the spotlight. In the meantime, follow @PeterHanksFX on Twitter for updates and analysis.
--Written by Peter Hanks, Strategist for DailyFX.com
Contact and follow Peter on Twitter @PeterHanksFX


