


DOW JONES, US DOLLAR, SILVER PRICE OUTLOOK:
- Dow Jones Industrial Average rebounds from its 100-Day Simple Moving Average (SMA) at 26,900
- Silver prices (XAG/USD) may form a “Death Cross” with 20- and 50-Day SMA lines turning bearish
- The US Dollar Index retraces after hitting a six-week high at 93.81
Dow Jones Index Outlook:
Dow Jones Industrial Average fell over 1.8% on Monday, dragged by materials (-4.88%), industrials (-4.2%) and healthcare (-2.54%) sectors (Table below). A whopping 86.7% of the components in the index ended lower, and all 9 sectors were in the red.
Investors are weighing lockdown plansin Europe amid resurging coronavirus cases, which may hurdle the economic recovery. Meanwhile, a pending US fiscal stimulus and Fed’s reluctance to ease more after the FOMC meeting also dampened prospects of further fiscal and monetary support. As a result, Asia-Pacific equities may open broadly lower on Tuesday.
The clock is ticking until the US Presidential Election, an event that is highly important and may carry a significant amount of uncertainty. Riding the volatility or staying on the sidelines until the political skies are cleared afterwards? This is a question that traders ought to consider.
Some assets may be more sensitive to election news, such as Dow Jones, S&P 500, Nasdaq, US Dollar index, USD/JPY, AUD/USD, gold, silver, and VIX.

Dow Jones Index Sector performance 21-9-2020
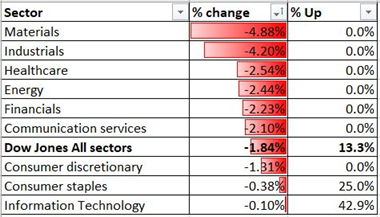
Source: Bloomberg, DailyFX
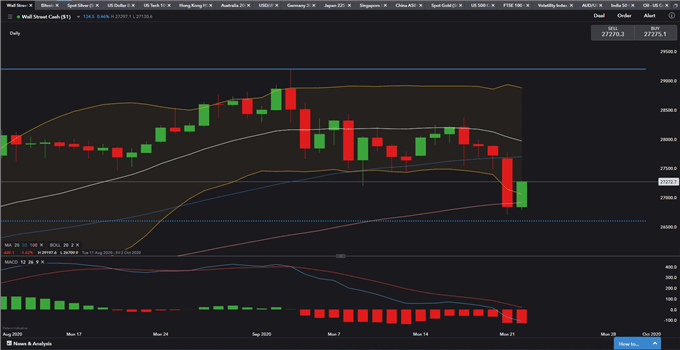
Technically,the Dow Jones index found some support at its 100-Day SMA and rebounded. The formation of a large bearish candlestick has led to a widening of its Bollinger Band, which flags more downside risk in the near term. The MACD indicator dived further into negative territory. Breaking the 100-Day SMA will likely open the door for further downside with an eye on 26,600 – the 23.6% Fibonacci retracement.
Dow Jones Index – Daily Chart
XAG/USD Price Outlook:
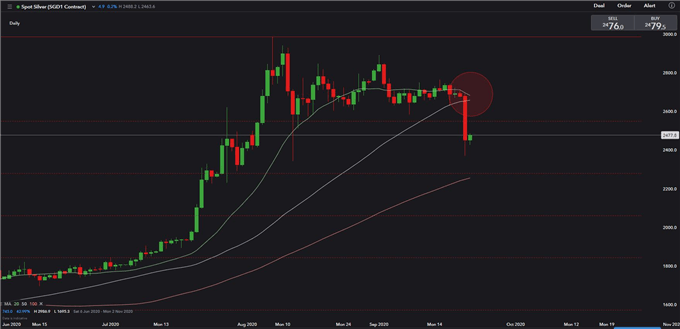
Silver prices plummeted over 8% on Monday, registering their largest single-day swing seen in more than one month. Similar to gold, silver has lost its perceived safe-haven characteristics recently, falling alongside risk assets when sentiment sours. A strong rebound in the US Dollar index last night likely catalyzed the freefall of XAG/USD, leading to a firm breaking of its 20- and 50-Day SMA.
The US Dollar is likely to remain a key factor influencer on silver prices, and also gold.
The potential cross over of its 20-Day SMA below 50-Day SMA is likely to form a “Death Cross”, which is a medium-term bearish indicator.
XAG/USD Price – Daily Chart
US Dollar Index Outlook:
The US Dollar index surged to its highest level in six weeks before paring some gains this morning. Rising coronavirus cases in Europe, a pending US stimulus package, and the US Presidential Election season probably have reignited demand for safety, and put the US Dollar on bid.
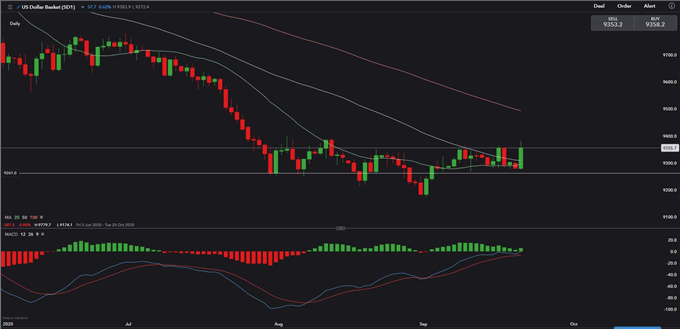
Technically, the US Dollar index attempted to break out a rangebound zone of 91.8-93.8, with its momentum biased towards the upside. The MACD indicator has converged with the price on the chart, suggesting a potential breakthrough above 93.8 resistance.
US Dollar Index – Daily Chart

--- Written by Margaret Yang, Strategist for DailyFX.com
To contact Margaret, use the Comments section below or @margaretyjy on Twitter


