


OIL FORECAST: CRUDE OIL PRICE ACTION UNDERMINED BY POTENTIAL BEARISH MOVING AVERAGE CROSSOVER
- Crude oil could struggle to catch a bid as demand concerns rise with market volatility
- Oil prices look mired by a bearish crossover of its 50-day and 200-day moving averages
- The commodity might face further selling pressure if trader risk aversion gains traction
Crude oil price action has slid markedly lower so far this month. The commodity is down more than 10% from August’s closing level after failing to take out technical resistance around the $43-handle. This decline appears to have invalidated the bullish trend formed by the series of higher lows since May.
CRUDE OIL PRICE CHART: DAILY TIME FRAME (23 APR TO 10 SEP 2020)
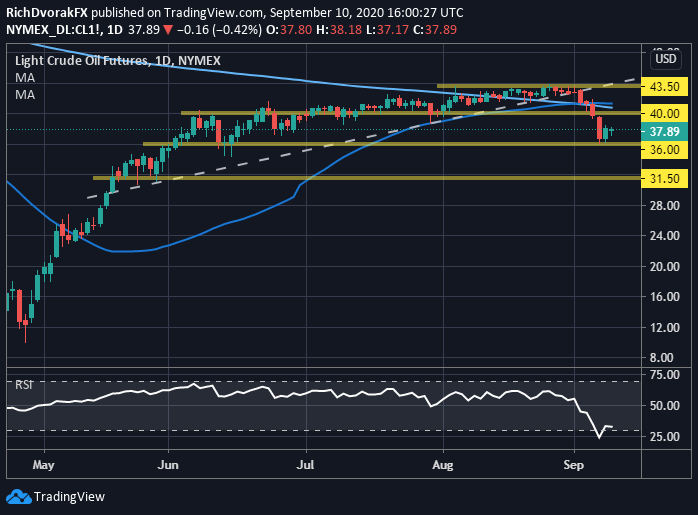
Chart created by @RichDvorakFX with TradingView
Crude oil prices tumbled lower alongside a sharp uptick in the S&P 500 VIX Index, or fear-gauge, as demand concerns mount and market sentiment starts to sour from its seemingly euphoric state. The recent influx of crude oil selling pressure pushed the commodity down to technical support residing near the $36.00-price level, which roughly aligns with May highs and June lows. Oil price action now faces the threat of a bearish moving average crossover. Specifically, the medium-term 50-day moving average could start to roll over and cross beneath its long-term 200-day moving average as the rebound in oil prices reverses.
| Change in | Longs | Shorts | OI |
| Daily | 3% | 0% | 2% |
| Weekly | -9% | 9% | -4% |
This looming ‘death cross’ might exacerbate potential crude oil selling pressure going forward - particularly if market volatility continues to tick higher and trader sentiment deteriorates further. That said, crude oil weakness could accelerate if bears can breach the $36.00-handle. This might open up the door to target the $31.50-zone as the next possible downside objective.

-- Written by Rich Dvorak, Analyst for DailyFX.com
Connect with @RichDvorakFX on Twitter for real-time market insight


