S&P 500 Price Outlook: Stocks Under Pressure as ISM Services PMI Report Disappoints
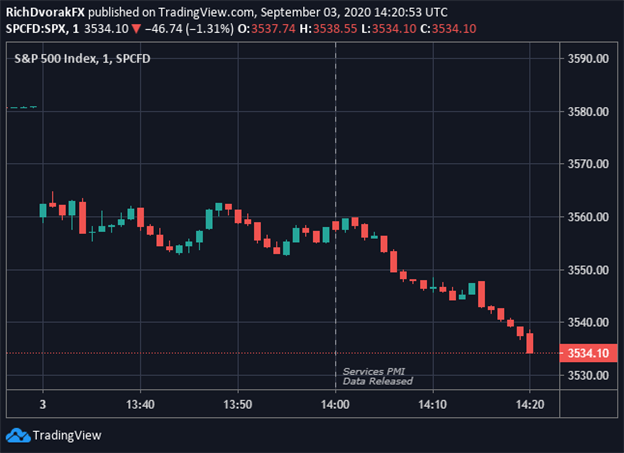
- S&P 500 index is sliding to fresh intraday lows following the latest services PMI data release
- Stock market sentiment sours as the largest sector of the US economy decelerates
- Services PMI data just released follows weekly jobless claims data published prior to the open
The S&P 500 Index is trading about 1% lower this morning. Stocks have faced added selling pressure since the Wall Street open as risk appetite deteriorates on the back of disappointing PMI data just released. The Institute for Supply Management (ISM) reported that its August 2020 Services PMI declined month-over-month to 56.9 from 58.1 previously.


S&P 500 INDEX PRICE CHART: 1-MINUTE TIME FRAME (03 SEP 2020 INTRADAY)

Chart created by @RichDvorakFX with TradingView
The services sector comprises roughly 75% of annual economic activity across America and thus weighs considerably on US GDP growth. Also, the decline in the services business activity component from 67.2 to 62.4 is worrisome, and likely encouraging the influx of risk aversion as the S&P 500 Index pulls back from all-time highs.
| Change in | Longs | Shorts | OI |
| Daily | -7% | 8% | 0% |
| Weekly | 7% | -11% | -3% |
The DailyFX Economic Calendar details that the headline services PMI reading missed market consensus as well. The headline services PMI reading still remains comfortably above 50.0, indicating economic activity is still expanding, but the sequential decline indicates growth is slowing.
That said, it seems that the disappointing services PMI report is casting a shadow over better-than-expected jobless claims figures released earlier this morning. This brings the upcoming release of monthly nonfarm payrolls into focus, due this Friday, September 04 at 13:30 GMT.
-- Written by Rich Dvorak, Analyst for DailyFX.com
Connect with @RichDvorakFX on Twitter for real-time market insight


