


NASDAQ 100, DAX 30, VIX INDEX OUTLOOK:
- The Nasdaq 100 Index is facing increasing pressure to nudge higher as non-tech stocks drag
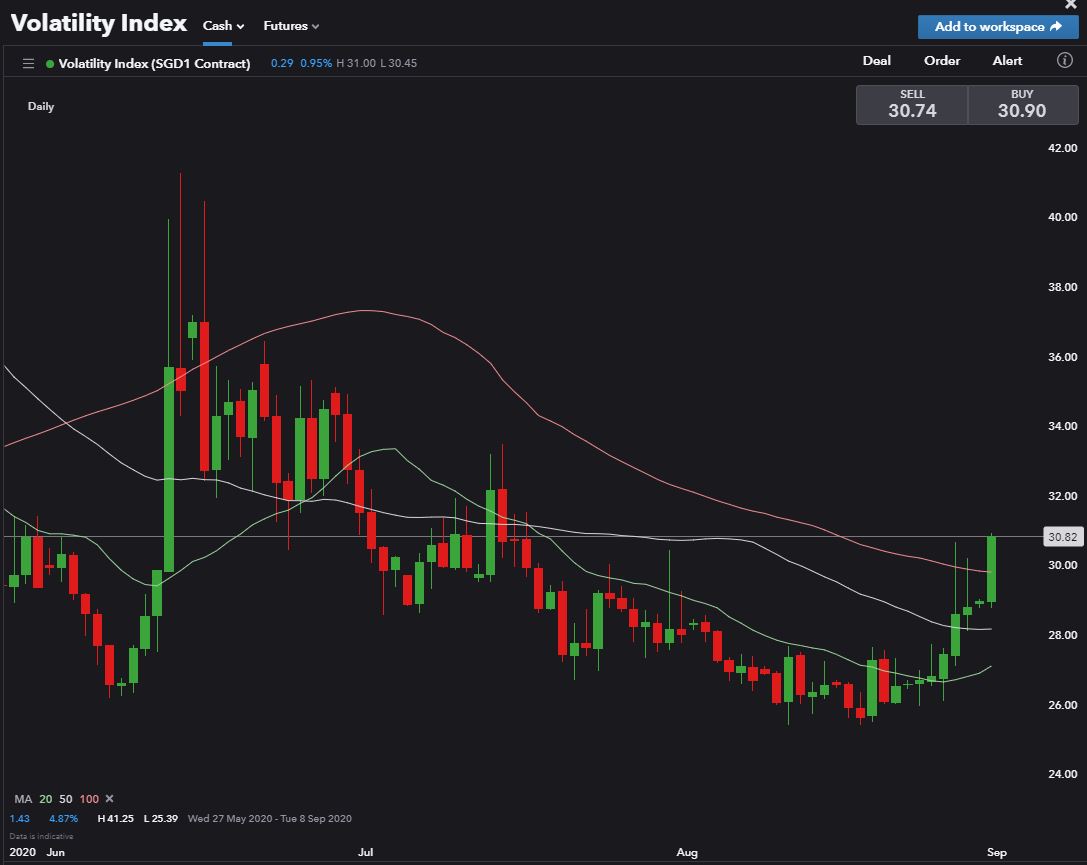
- Stock market’s ‘Fear Gauge’ – the Volatility Index (VIX) surged to its high level since mid-July
- Germany’s DAX 30 Index fell with S&P 500 and Dow Jones, testing a key support level at 12,950
Nasdaq Index Outlook:
The Nasdaq 100 Index defied gravity on Monday, climbing 0.68% to a fresh historic high of 11,755. Its performance eclipsed a 0.22% drop in the S&P 500 and a 0.78% fall in the Dow Jones. Apple (+3.4%) and Tesla (+12.6%) were among the biggest tech gainers last night, boosted by their stock splits. However, news surrounding Beijing’s intervention in the TikTok’s sale of its US operation, weighed on Microsoft (-1.48%) and Walmart (-1.03%) – two of the promising takeover candidates.
It is also worth noting that the VIX, often referred to as the stock market’s ‘Fear Gauge’, spiked above 30 - its highest level seen in about one and half months, suggesting that the 5-month long stock market rally may be running out of steam and due for a technical pullback.
VIX – Daily Chart
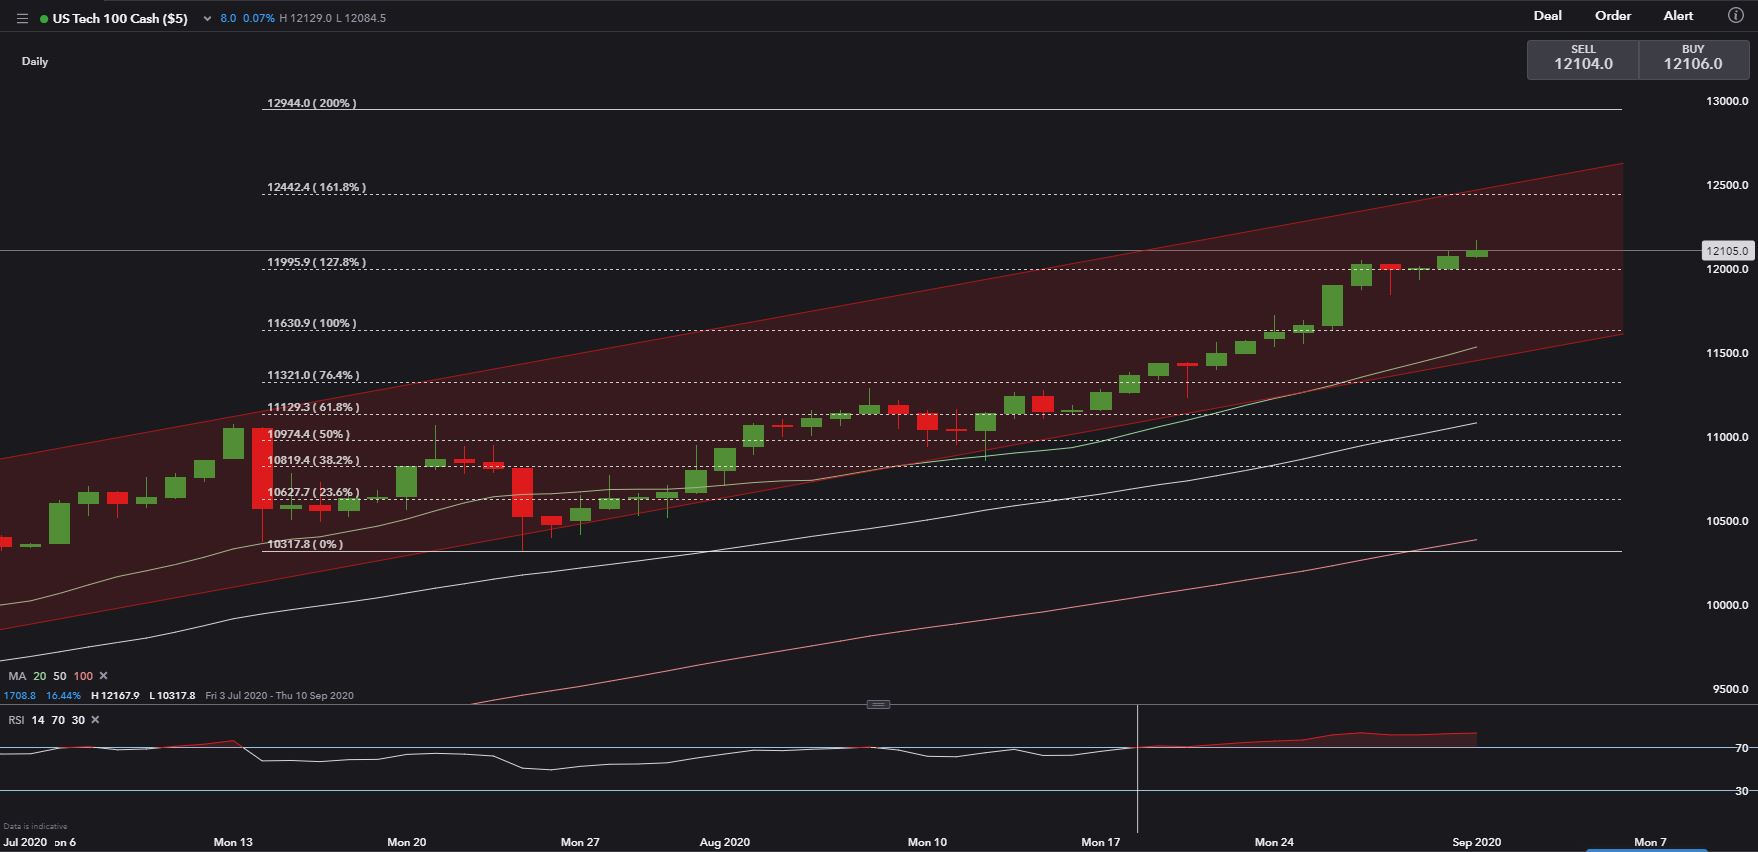
Technically, the Nasdaq 100 is riding an upward trend as highlighted in the chart below. Its overall trend remains bullish, with an immediate resistance level found at the 161.8% Fibonacci extension of 12,440. The RSI indicator, however, has shown signs of overbought as it maneuvered above the 70.0 level for nearly two weeks. A technical pullback would likely bring it down to test the immediate support level at 12,000 – the 127.8% Fibonacci extension.
Nasdaq Index – Daily Chart
DAX 30 Index Outlook:
Germany’s DAX 30 Index fell 0.71% on Monday alongside a broader retracement in the European markets. Futures are extending losses this morning, suggesting that Asia-Pacific stocks may face a tough time on Tuesday. The sectoral performance also displayed a clear ‘risk off’ pattern as shown below:
Sector-wise, defensive-linked utilities (+0.36%), healthcare (+0.33%), consumer discretionary (+0.14%) were among the best performers, whereas financials (-1.68%), industrials (-1.60%) and communication services (-1.54%) were lagging.
DAX 30 Index Sector performance 31-8-2020

Source: Bloomberg, DailyFX
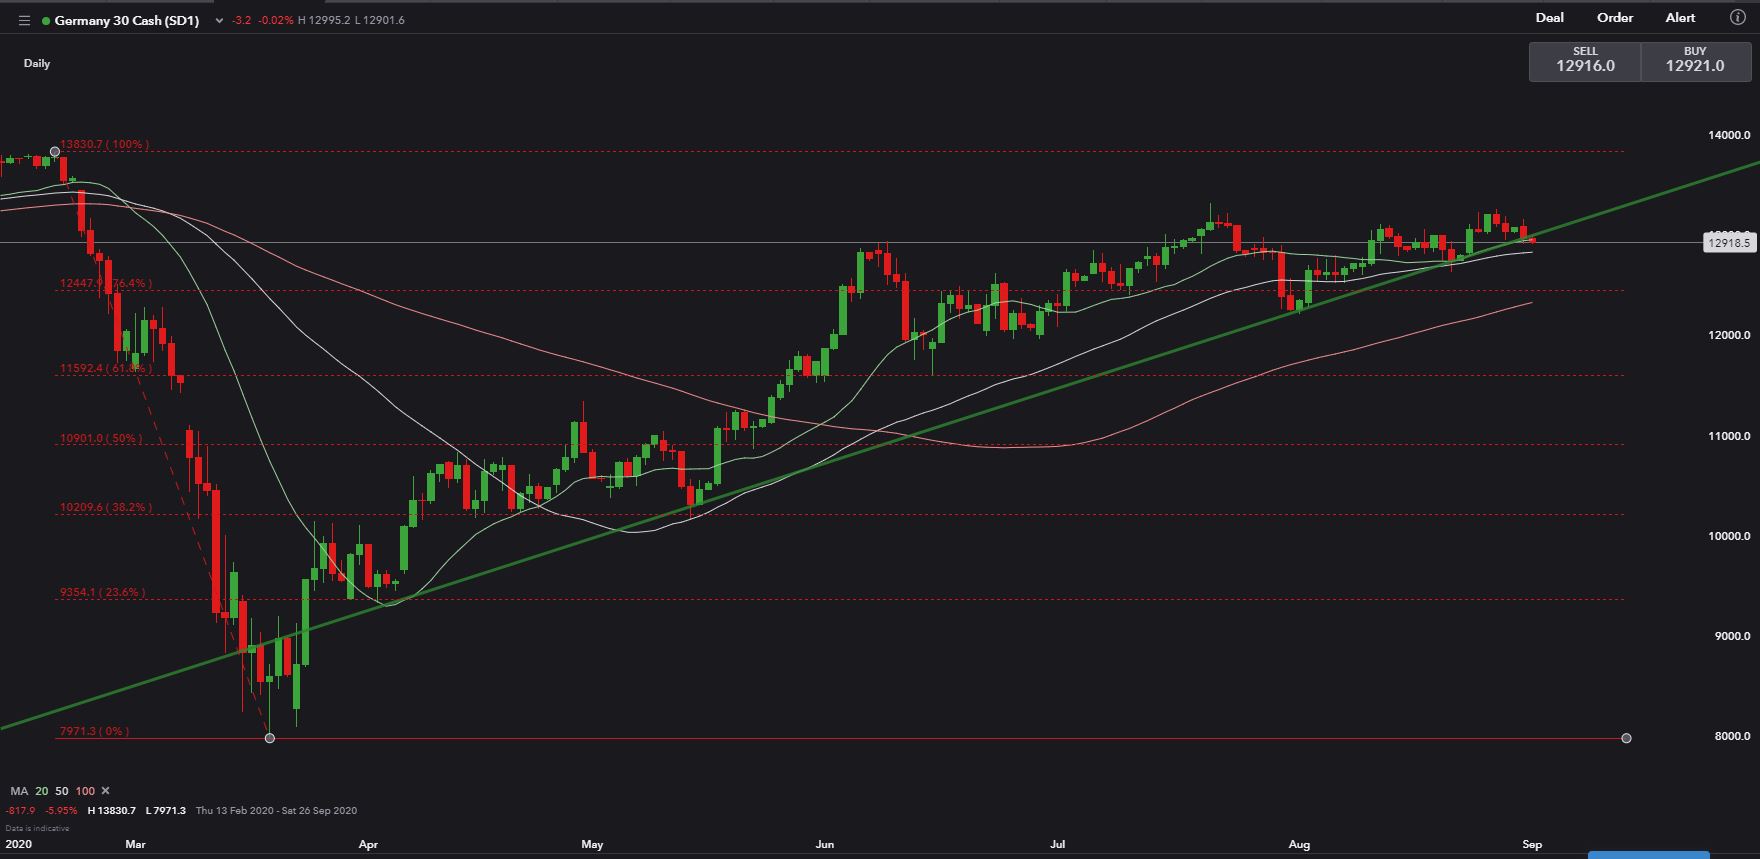
Technically, DAX is about to test a key support level at 12,950 – the 20-Day Simple Moving Average (SMA) line. Breaking blow its 20-Day SMA will probably open the room for more downside towards 12,450 – the 76.4% Fibonacci retracement.
DAX 30 Index – Daily Chart
Dow Jones Index Outlook:
All eleven sectors ended lower in the Dow Jones Industrial Average on Monday, with only 23.3% of its components finishing in the green.
Dow Jones Index Sector performance 31-8-2020

Source: Bloomberg, DailyFX
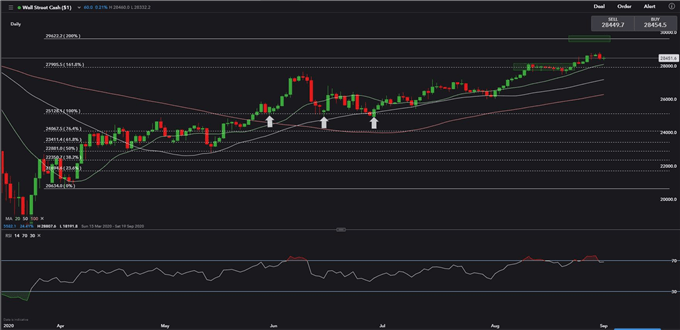
Technically, the Dow is riding a bullish trend but may face some technical pullback as the RSI indicator has flipped back from the overbought zone above 70.0. Immediate support and resistance levels can be found at 27,900 and 29,600 respectively.
Dow Jones Index – Daily Chart

--- Written by Margaret Yang, Strategist for DailyFX.com
To contact Margaret, use the Comments section below or @margaretyjy on Twitter


