


OIL FORECAST: CRUDE OIL PRICE CLIMBING HIGHER AS RISK APPETITE PRESSES ONWARD
- Oil price action could keep gaining ground as perceived market volatility vanishes
- Crude oil bulls look to top technical resistance around the $43.00-price level
- VIX Index might break lower if euphoric sentiment and trader risk appetite is sustained
Crude oil prices are trading modestly higher to start the week as the commodity aims to extend its advance. The price of oil has gained ground for the last three consecutive weeks and the move seems to largely mirror the tumble lower by the VIX. The VIX Index, or fear-gauge, reflects expected S&P 500 volatility over the next 30-days, and the gauge tends to hold an inverse relationship with risk assets like crude oil.
| Change in | Longs | Shorts | OI |
| Daily | 7% | -8% | 2% |
| Weekly | 18% | -26% | 1% |
CRUDE OIL PRICE CHART & VIX INDEX OVERLAID: 4-HOUR TIME FRAME (22 APR TO 24 AUG 2020)
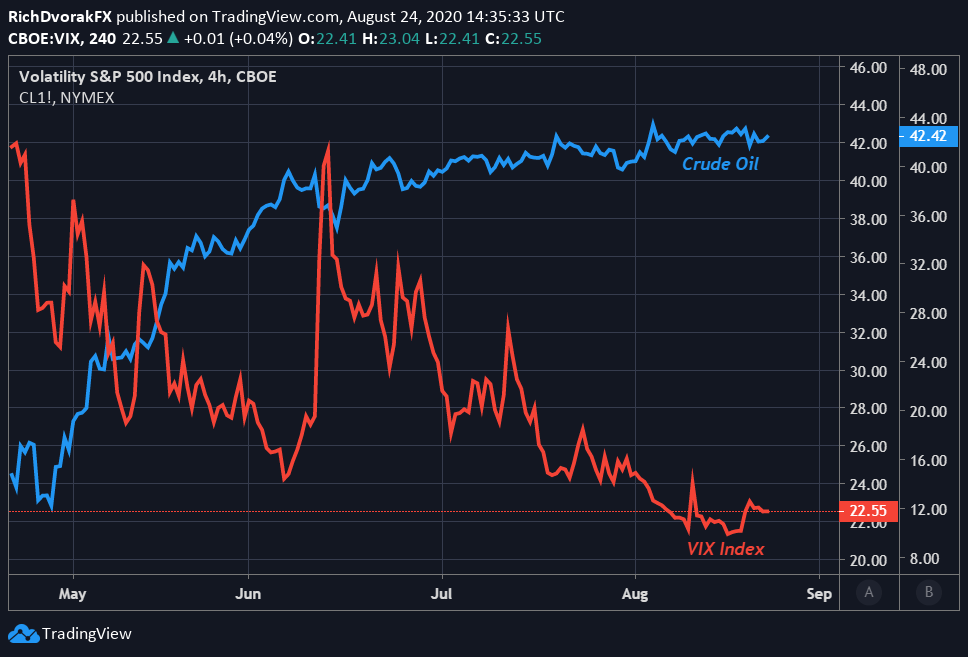
Chart created by @RichDvorakFX with TradingView
That said, there could be potential for crude oil price action to continue its climb amid falling volatility. This is considering a declining VIX Index generally indicates improving appetite for risk as expected market volatility – and demand for S&P 500 downside protection – diminishes. Likewise, as with stocks, the direction of crude oil is generally tied to risk appetite, economic activity, and prospects for global GDP growth.

However, a sharp reversal higher by the VIX Index would likely be associated with a breakdown in broader sentiment and economic conditions. In turn, this could correspond with bearish headwinds for oil prices. More information on the relationship between crude oil and volatility can be found in our quarterly crude oil forecast above.
CRUDE OIL PRICE CHART: DAILY TIME FRAME (22 MAY TO 24 AUG 2020)
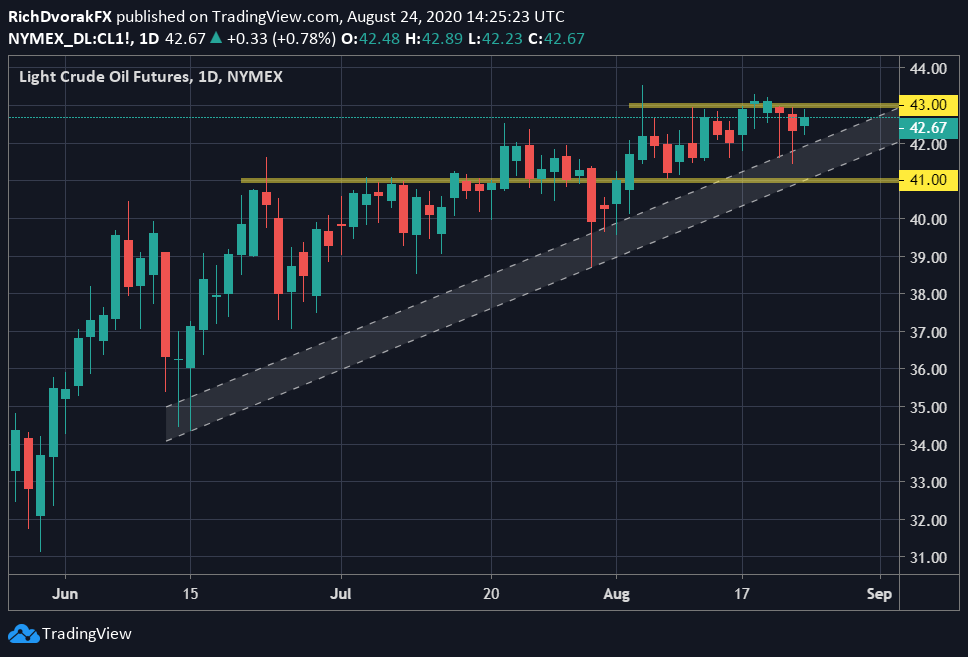
Chart created by @RichDvorakFX with TradingView
Crude oil prices nevertheless remain buoyed by a bullish trend extended through a series of higher lows since mid-June. Technical resistance facing crude oil price action stands out around the $43.00-price level and month-to-date highs. Eclipsing this barrier of resistance, combined with a sustained decline by the VIX Index, might hint at potential for crude oil prices to embark on another leg higher.
Read More – Crude Oil Outlook: OPEC+ Curbs Supply Cut as GDP Growth Recovers
-- Written by Rich Dvorak, Analyst for DailyFX.com
Connect with @RichDvorakFX on Twitter for real-time market insight


