


S&P 500 PRICE OUTLOOK: STOCKS PRESSING ALL-TIME HIGHS, VIX INDEX FALLS
- S&P 500 Index closed above its pre-pandemic record high price of 3,386.15
- VIX ‘fear-gauge’ has edged notably lower but is still relatively elevated
- Upbeat trader sentiment might sustain the stock market rally – for now
The S&P 500 Index just set a new record with its latest close at the 3,389.78-price mark. This modestly eclipses its prior all-time high of 3,386.15 set on February 19 prior to the sharp selloff that ensued on the back of the coronavirus pandemic. Stocks have been able to stage a remarkable recovery largely thanks to coordinated action from global governments and central bank.
| Change in | Longs | Shorts | OI |
| Daily | 2% | -6% | -3% |
| Weekly | 17% | -18% | -4% |
In turn, this largely flooded the market with liquidity, which has not only helped restore appetite for risk, but has likely enabled it as well. Meanwhile, this has exerted considerable pressure on the S&P 500 VIX Index, or fear-gauge, as investor demand for downside protection evaporates amid the sustained improvement in trader sentiment.
S&P 500 PRICE CHART WITH VIX INDEX OVERLAID: DAILY TIME FRAME (DEC 2019 – AUG 2020)
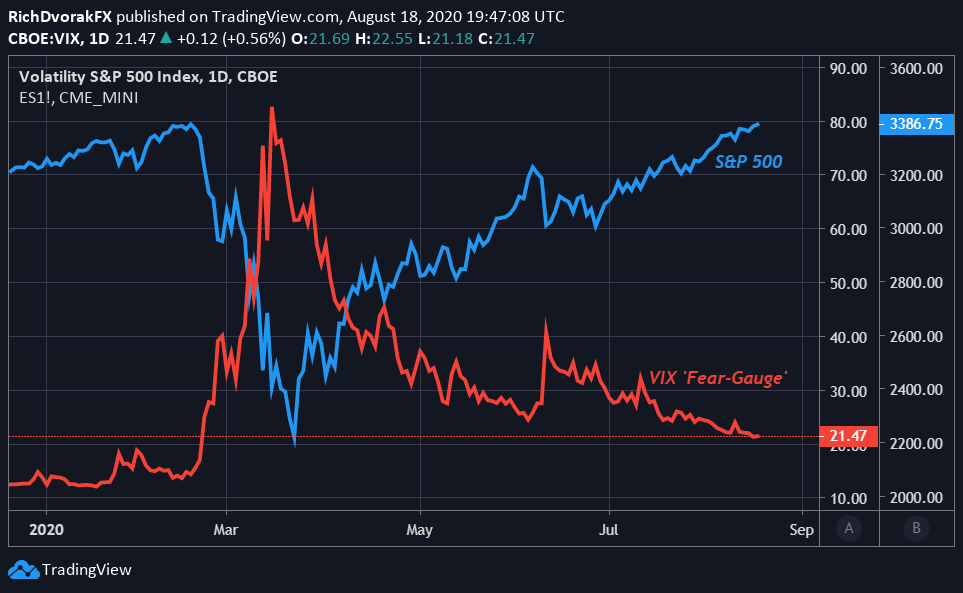
Chart created by @RichDvorakFX with TradingView
This was recently pointed out in a market positioning report detailing options traders positioned for an all-time high. Volatility suppression could continue in the event that potentially bearish catalysts fail to materialize, which would likely correspond with sustained investor optimism and confirmation of new record highs for the S&P 500.
Looking to the DailyFX Economic Calendar brings to focus the upcoming release of FOMC minutes due Wednesday, August 19 at 18:00 GMT. Though details from the most recent Federal Reserve meeting are not expected to unveil any large surprises, but language found within the FOMC minutes can provide insight on the discussions held by Fed officials. Another scheduled risk event includes the release of monthly PMI data from IHS Markit on Friday, August 21. Evidence of a stalling economic recovery could give investors the jitters and prompt an influx of risk aversion.

That said, the VIX Index has interestingly hovered above the 20.00-handle and trades at a level notably higher than where it was before the onset of coronavirus-induced market turmoil. Perhaps comparatively elevated VIX readings today could be explained by relatively high VIX Index measurements that gauge expected stock market volatility beyond the next 30-days. For example, the current VIX Index futures contract is currently trading around the 21.50-mark, but the October VIX Index futures contract is trading above the 28.00-level.
Keep Reading: US Dollar on Defense as Treasury Yields Retreat – USD Levels to Watch
-- Written by Rich Dvorak, Analyst for DailyFX.com
Connect with @RichDvorakFX on Twitter for real-time market insight


