

GBP/USD, GBP/NZD and FTSE 100 Prices, Charts and Analysis:
- Pennant formation in cable continues to play out.
- FTSE 100 remains rangebound.
- GBPNZD above 2.00 and the 200-dma.

A quiet start to the week with little in the way to guide markets. This week the economic calendar is quiet apart from the resumption of EU/UK trade on Tuesday, FOMC minutes on Wednesday and the latest PMIs on Friday. For all market-moving data releases and events see the DailyFX Economic Calendar
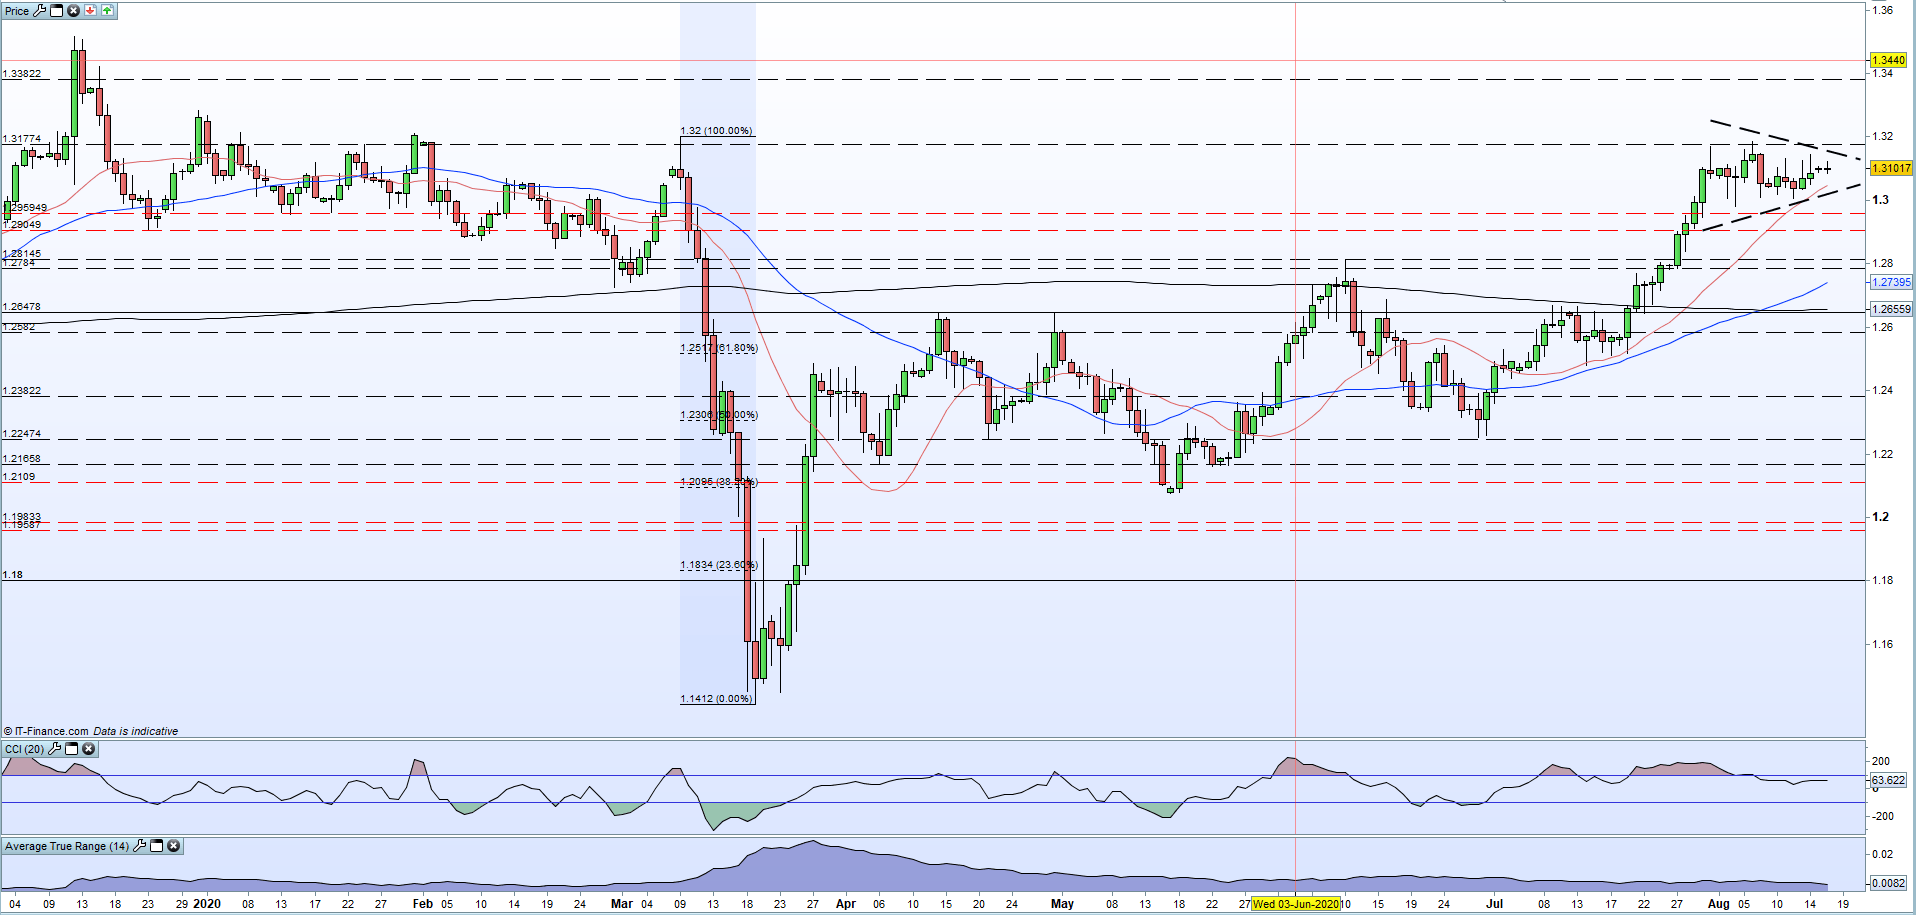
GBP/USD remains underpinned and continues to form a basic bullish pennant pattern. As we near the apex of this formation, the chances of an upside breakout grow.
GBP/USD Daily Price Chart (December 2019 – August 17, 2020)
| Change in | Longs | Shorts | OI |
| Daily | 2% | -7% | -1% |
| Weekly | 13% | 7% | 11% |
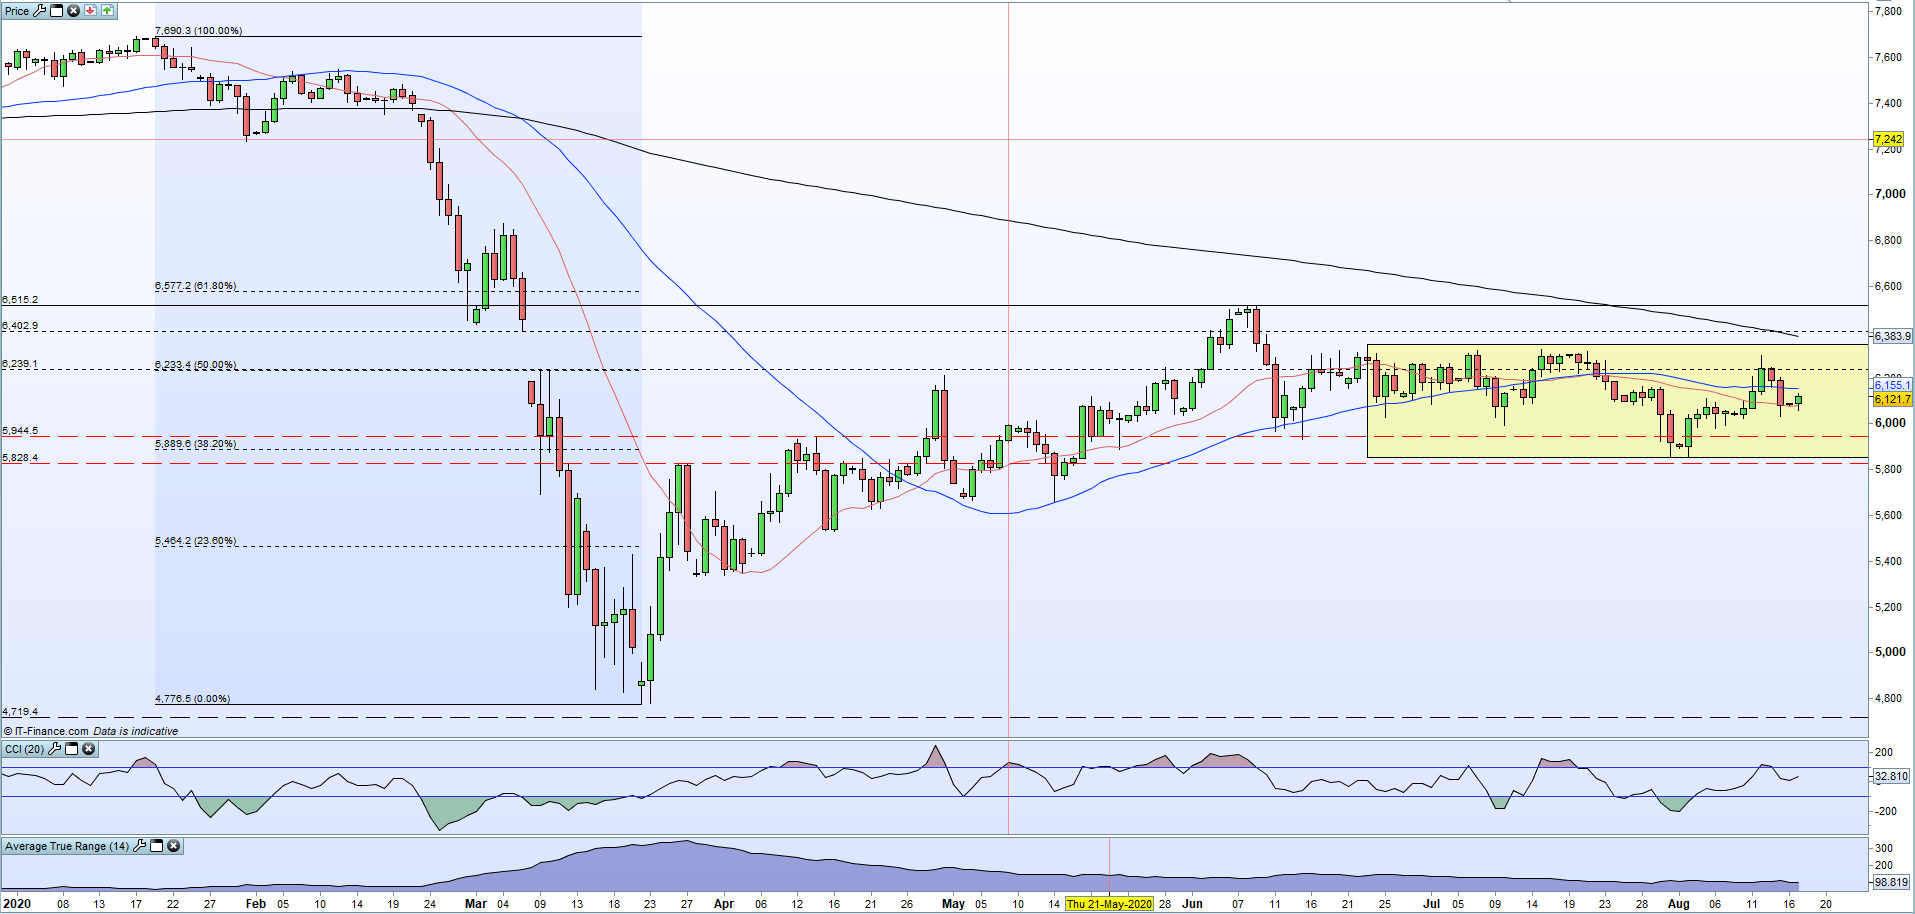
The FTSE 100 remains stuck in a range and will need a decent driver to break either way. Today’s trading range is limited and the UK big board will wait to see if anything comes out of the EU/UK trade talks or if Sterling makes a move. Price action remains either side of both the 20- and 50-day moving averages.
FTSE 100 Daily Price Chart (January – August 17, 2020)
Traders of all levels and abilities will find something to help them make more informed decisions in the new and improved DailyFX Trading Education Centre
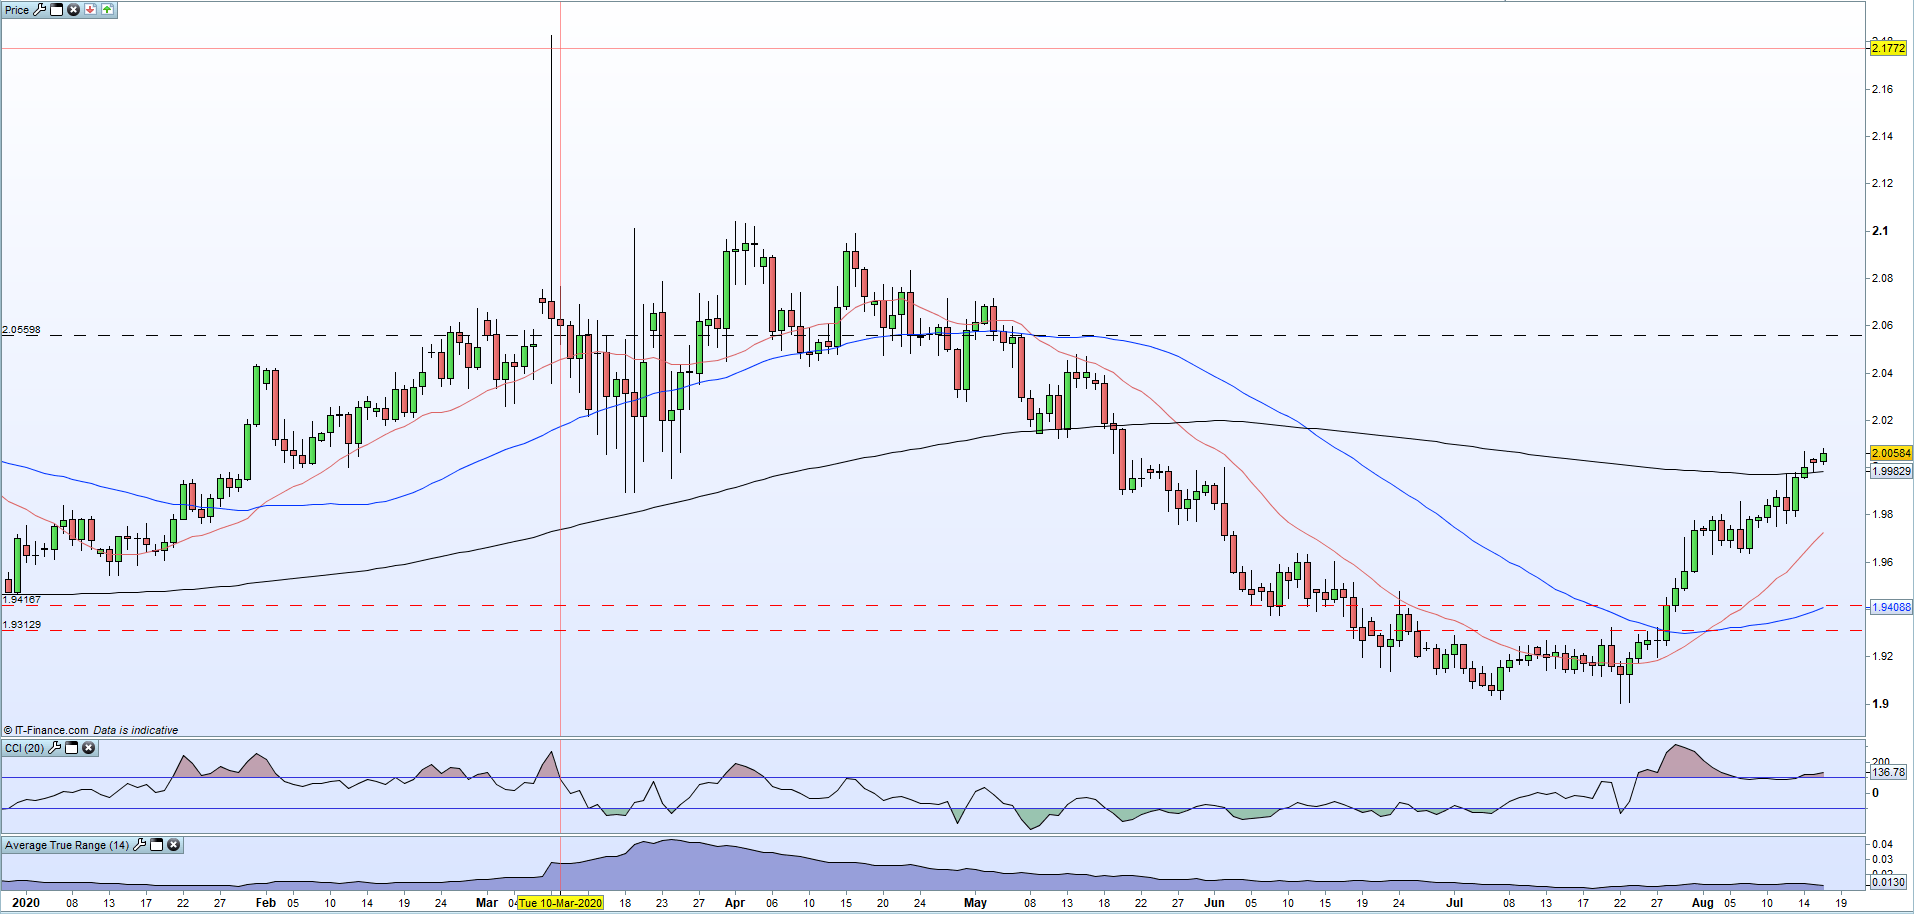
GBP/NZD continues to press higher and has now broken and opened above the 200-day moving average and the psychological 2.00 level. If the 200-dma remains supportive, the pair will likely consolidate before continuing to edge higher.
GBP/NZD Daily Price Chart (January – August 17, 2020)
What is your view on Sterling – bullish or bearish?? You can let us know via the form at the end of this piece or you can contact the author via Twitter @nickcawley1.