


USD/ZAR PRICE ANALYSIS
- Short-term bull run after Russian COVID-19 vaccine induces ‘risk-on’ sentiment
- USD/ZAR hovering around 17.5000 key level
- Local economic data and political instability does not bode well
- Systemic potential with Turkish Lira (TRY) devaluation
DOMINANT MACROECONOMIC ENVIRONMENT
The South African Rand (ZAR) has shown recent strength across majors after Russian president Vladimir Putin announced a possible vaccine for COVID-19. Strength was seen amongst Emerging Market (EM) currencies as a risk-seeking mood swept across financial markets. This optimistic bubble has since been burst as further testing is being called for by the World Health Organization (WHO) after a ‘hurried’ trial period by the Russians. The enduring tit for tat exchange between the US and China has supplemented risk aversion leaving EM currencies like the ZAR in the lurch. How will Q3 play out for USD/ZAR?
Visit the DailyFX Educational Center to discover why news events are Key to Forex Fundamental Analysis
USD/ZAR: DAILY CHART
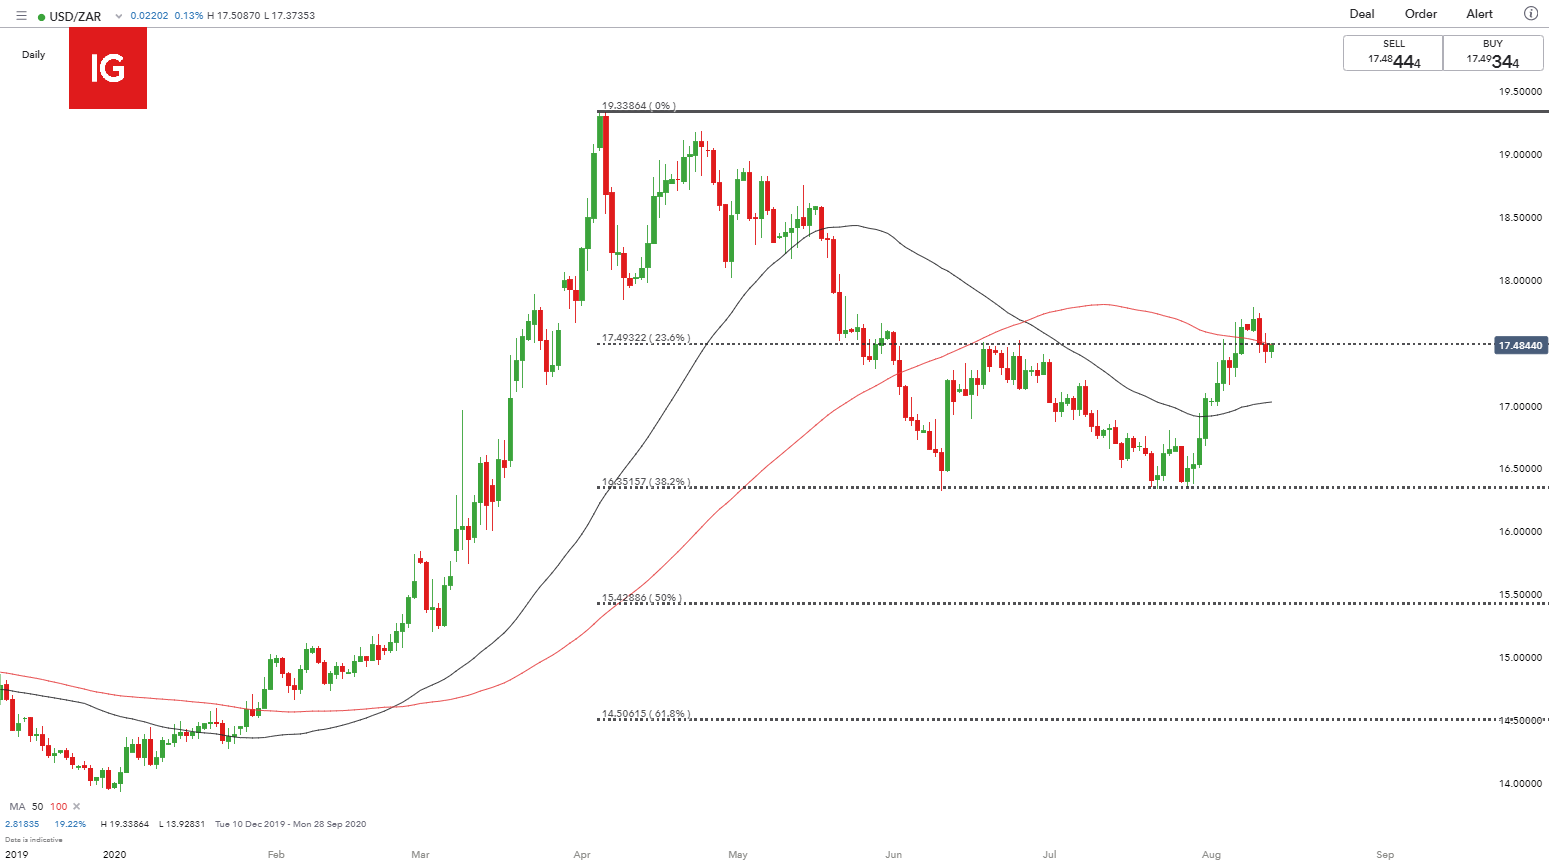
Chart prepared by Warren Venketas, IG
The USD/ZAR daily chart above shows recent range-bound movement between the 23.36% (17.4932) and 38.2% (13.3515) Fibonacci levels – Fibonacci is taken from February 2018 low to April 2020 high. USD/ZAR is currently trading at the topside of the range with the 100-day Moving Average (MA) not far away. If price can break above the 100-day MA, this could signal further upside for the pair.
August has been a good month for the US Dollar which has shown strength month-date after an 11% decline on the Dollar Index (DXY) from March highs. An extension of Dollar strength may provide a tailwind for USD/ZAR bulls to break above the 23.6% Fibonacci level in search of additional resistance.
USD/ZAR: 4-HOUR CHART
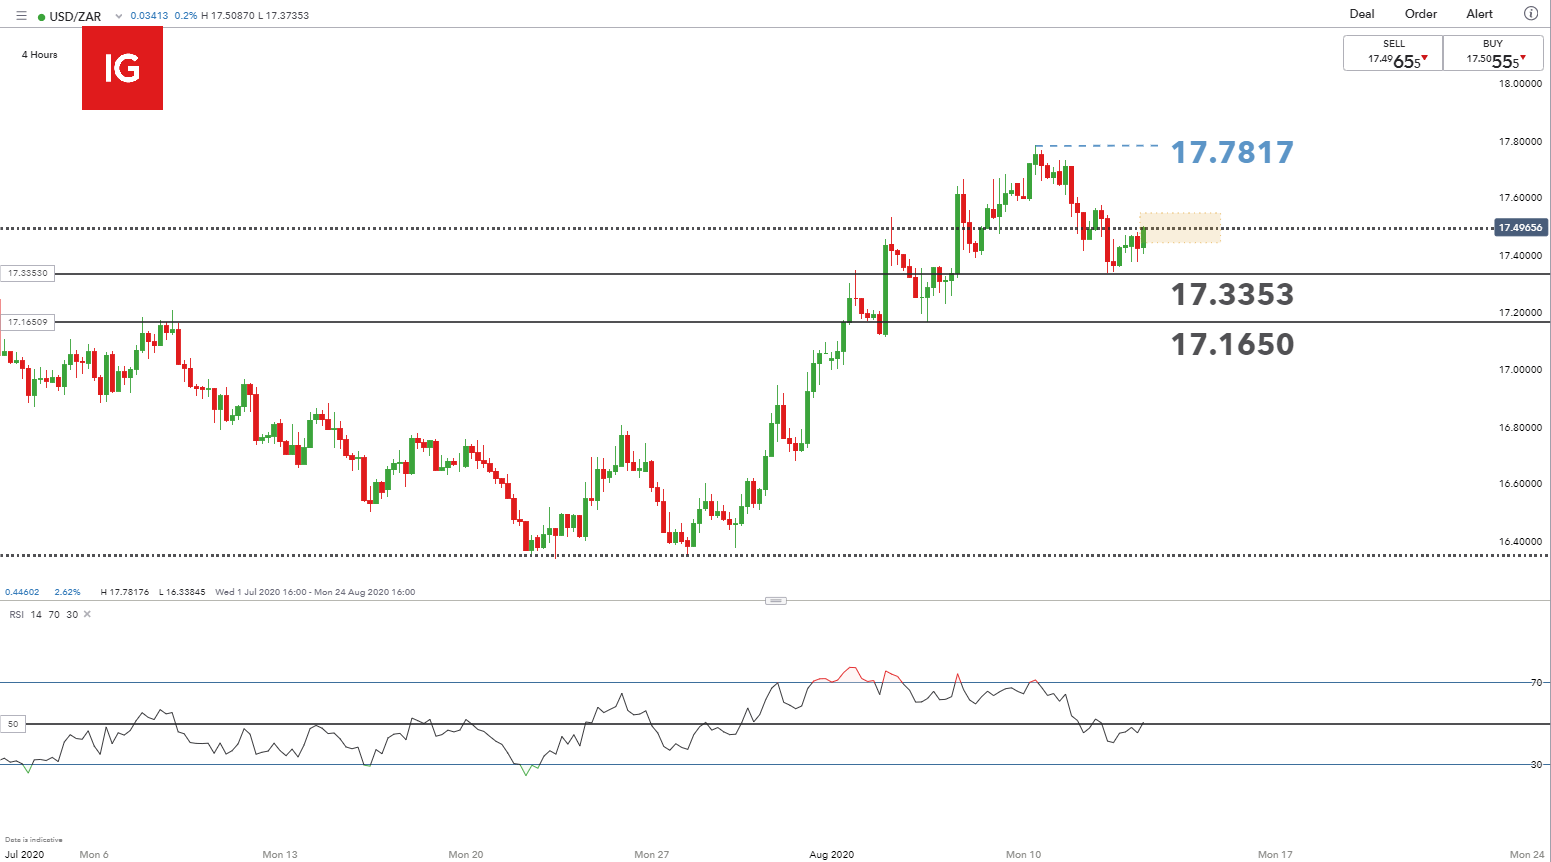
Chart prepared by Warren Venketas, IG
Dialing into the 4-hour chart, a few key levels appear with the 23.6% Fibonacci zone coinciding with the 17.5000 psychological level (yellow). A push above this level will see the 17.7817 level provide initial resistance. Bears may be eyeing a continuation of the short-term downward move to 17.3353 and possibly further down to the recent swing low 17.1650.
The 50 level (black) on the Relative Strength Index (RSI) confirms the indecision between bulls and bears. Generally, an RSI reading of above 50 suggests a bullish bias and vice versa so traders will look to this as a supporting factor for further directional guidance.

FALLING TURKISH LIRA MAY HAVE NEGATIVE REPERCUSSIONS FOR SOUTH AFRICA
The Turkish Lira (TRY) may seem a world away from South Africa but a failing TRY may have very real implications for the Rand and the country as a whole. The TRY being an EM currency has contagion effects across other EM’s with South Africa being on the top of that list. The current exchange rate risk in Turkey has led to increased volatility. An increase in volatility will call for higher risk premiums by investors as compensation. This may be seen in South Africa as well which will not benefit the ZAR. Rand traders should monitor the Lira situation to avoid any external surprises.
POOR ECONOMIC DATA COULD HAVE LONG-TERM EFFECTS
South Africa has had a tough time containing the COVID-19 virus by trying to balance a struggling economy with stringent lockdown measures. With former problems still plaguing South Africans such as the infamous ‘loadshedding’ (blackouts), economic recovery has been extremely difficult during these testing times.

Poor economic data with manufacturing and retail sales statistics coming in at depressed levels, the future of the South African economy remains gloomy. As a developing nation, South Africa may take longer to recover (economically) from the global pandemic relative to more developed countries. The long-term outlook for the Rand does not look rosy with much of its recent strength coming from a weaker US dollar as opposed to a strong Rand, and with global and local factors stacking against the ZAR is there any long-term hope for bears?
Stay up to date with global news and events with the DailyFX Economic Calendar
USD/ZAR STRATEGY MOVING FORWARD
Arguments for both bulls and bears have merit, but fundamental factors seem to be pulling the strings which will ultimately determine the USD/ZAR outlook. With so many variables at play, USD/ZAR traders will need to observe global and local economic news flows during this period of uncertainty to provide further guidance. Key trading points to consider:
- 17.5000 psychological level (23.6% Fibonacci)
- Technical analysis – RSI level
- Turkish Lira exchange rate risk
- US-China tensions
- South African politics and economic data
--- Written by Warren Venketas for DailyFX.com
Contact and follow Warren on Twitter: @WVenketas


