


Technical Outlook:
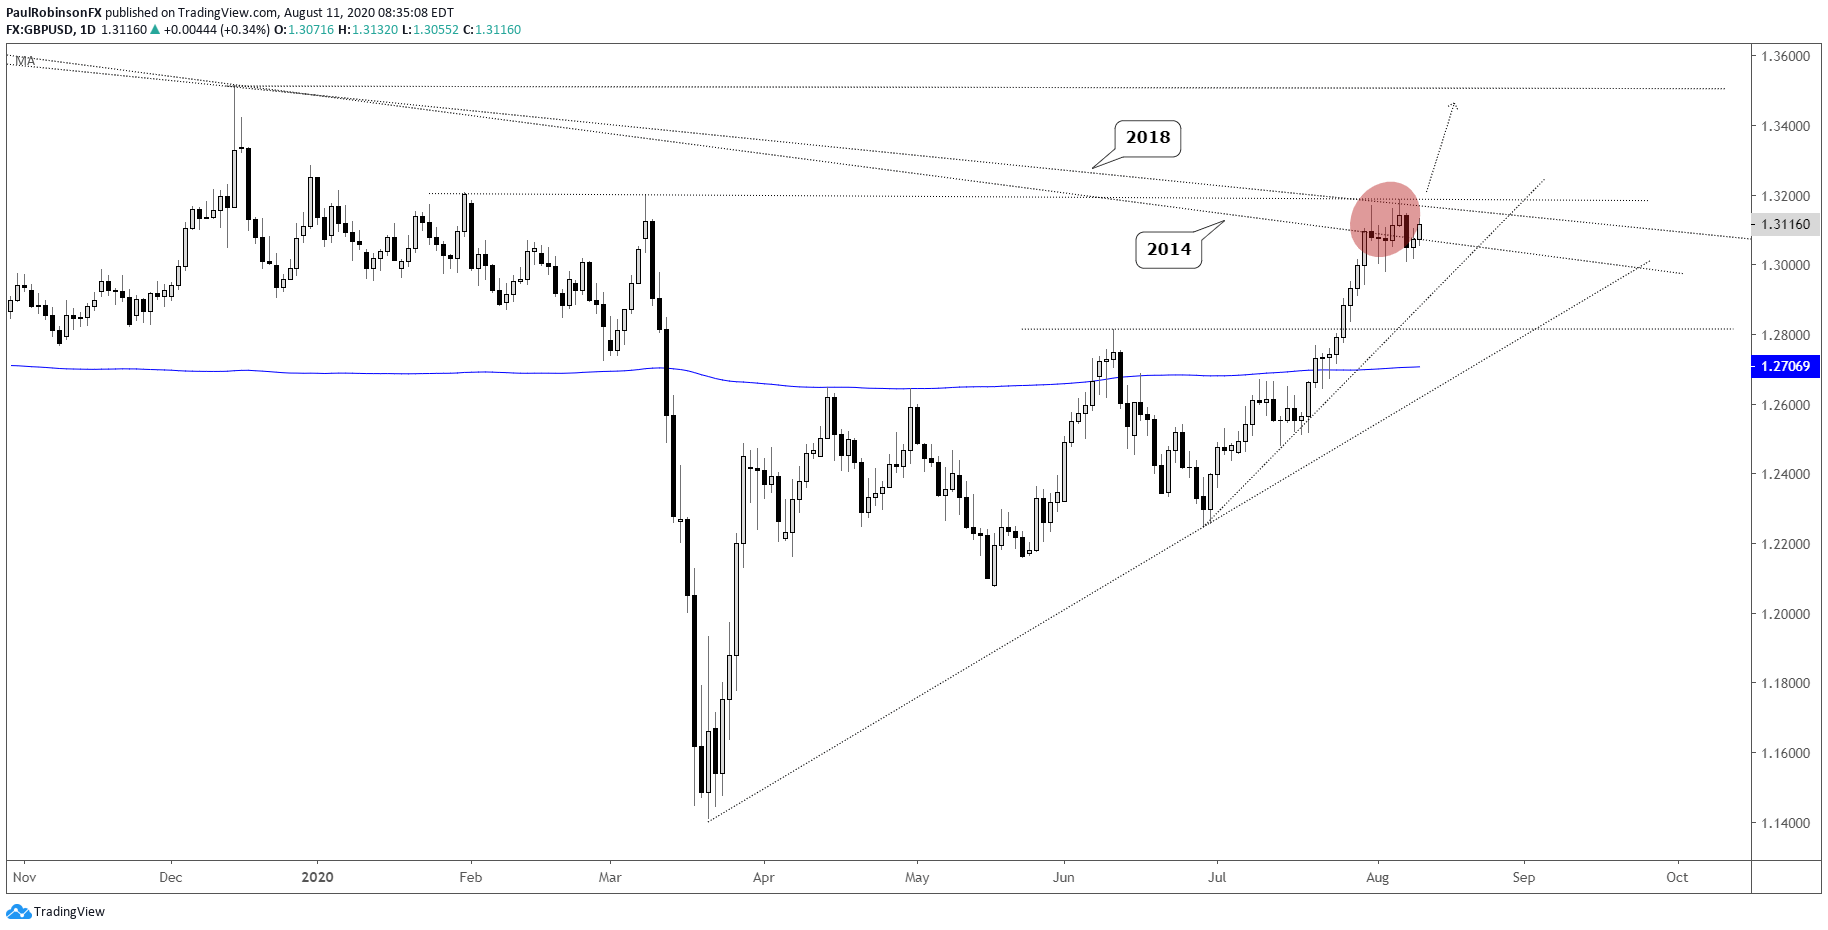
GBP/USD continues to move sideways after having tagged an area of strong resistance in recent trade. There is confluence between trend-lines running down off the 2014 and 2018 peaks and a pair of swing highs that were carved out just prior to the corona meltdown. The way it is moving horizontal is bullish thus far. The trend remains pointed higher since March and looks headed to extend further. The cue for the next move will be to trade above resistance pegged at 13206. A breakout from there is seen as having cable in open space with potential to run to the December spike-high over 13500.

GBP/USD Daily Chart (consolidating, watch 13206 level)
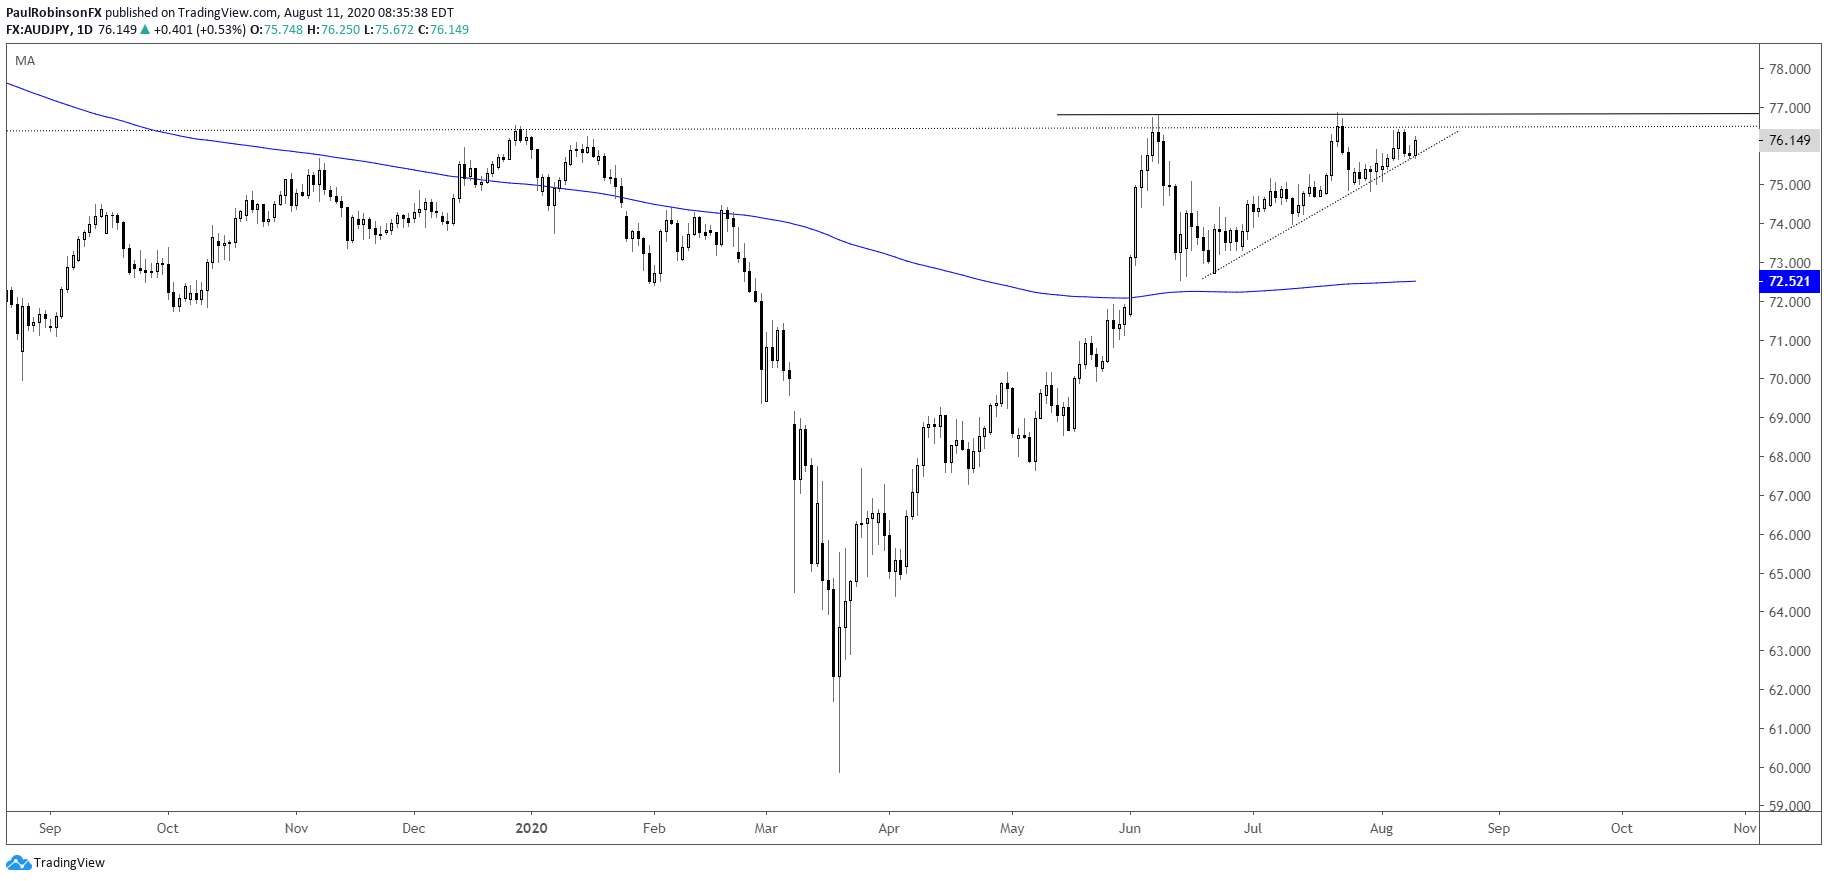
AUD/JPY has been holding onto a trend-line from June quite well, which has price pressed up against horizontal resistance and creating an ascending wedge. These patterns tend to be bullish, so a breakout above 7687 is considered the ‘official trigger’ for higher prices. If a breakout fails, however, and takes out the underside line of the pattern then we could quickly see price decline. But for now, will run with a breakout should it happen. Further supporting more upside at the moment is a generally strong appetite for risk.
AUD/JPY Daily Chart (ascending wedge forming)
For all the charts we looked at, check out the video above…
Resources for Forex Traders
Whether you are a new or an experienced trader, DailyFX has several resources available to help you; indicator for tracking trader sentiment, quarterly trading forecasts, analytical and educational webinars held daily, and trading guides to help you improve trading performance.
---Written by Paul Robinson, Market Analyst
You can follow Paul on Twitter at @PaulRobinsonFX


