


Copper, XCU/USD, US-China Trade Tension, Chilean Copper Production – Talking Points:
- Copper prices seem to have stalled just shy of key chart resistance as geopolitical tensions weigh on the global-growth proxy.
- Fading supply-chain issues may be weighing on copper as Peruvian production increased significantly over the last 3 months.
The price of copper has long been utilized as a gauge of world economic growth, with rising prices tending to suggest an increase in global manufacturing and construction.
However, the ductile metal’s rally back above the yearly open seems to have stalled just short of the 2019 high, despite recent manufacturing PMI data out of the United States (50.9), Canada (52.9), China (52.8), the Euro-zone (51.8) and Australia (53.5) all rising into expansionary territory.
As noted in previous reports, supply-and-demand dynamics may be to blame for copper’s relatively subdued performance as a notable increase in Peruvian production seemed to successfully counterbalance a modest decline in Chilean copper production.
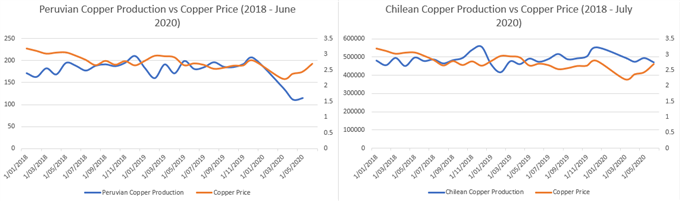
Source - Bloomberg
Furthermore, geopolitical tensions between the US and China, combined with a ‘second wave’ of coronavirus infections in multiple locations could be weighing on the global-growth proxy, as the number of confirmed cases globally soars above 18.5 million.
Given President Donald Trump’s statements that he doesn’t “feel the same way about the deal”, market participants may cut back their exposure to trade-sensitive assets ahead of ‘phase-one’ trade deal discussions on August 15, as the risk of a break-down in relations becomes more likely.
With that in mind, copper prices may continue to stall ahead of the 2019 year high as investors focus on developments between the world’s two largest economies.
Copper (XCU/USD) Daily Chart – Price Looking to Consolidate at Key Support
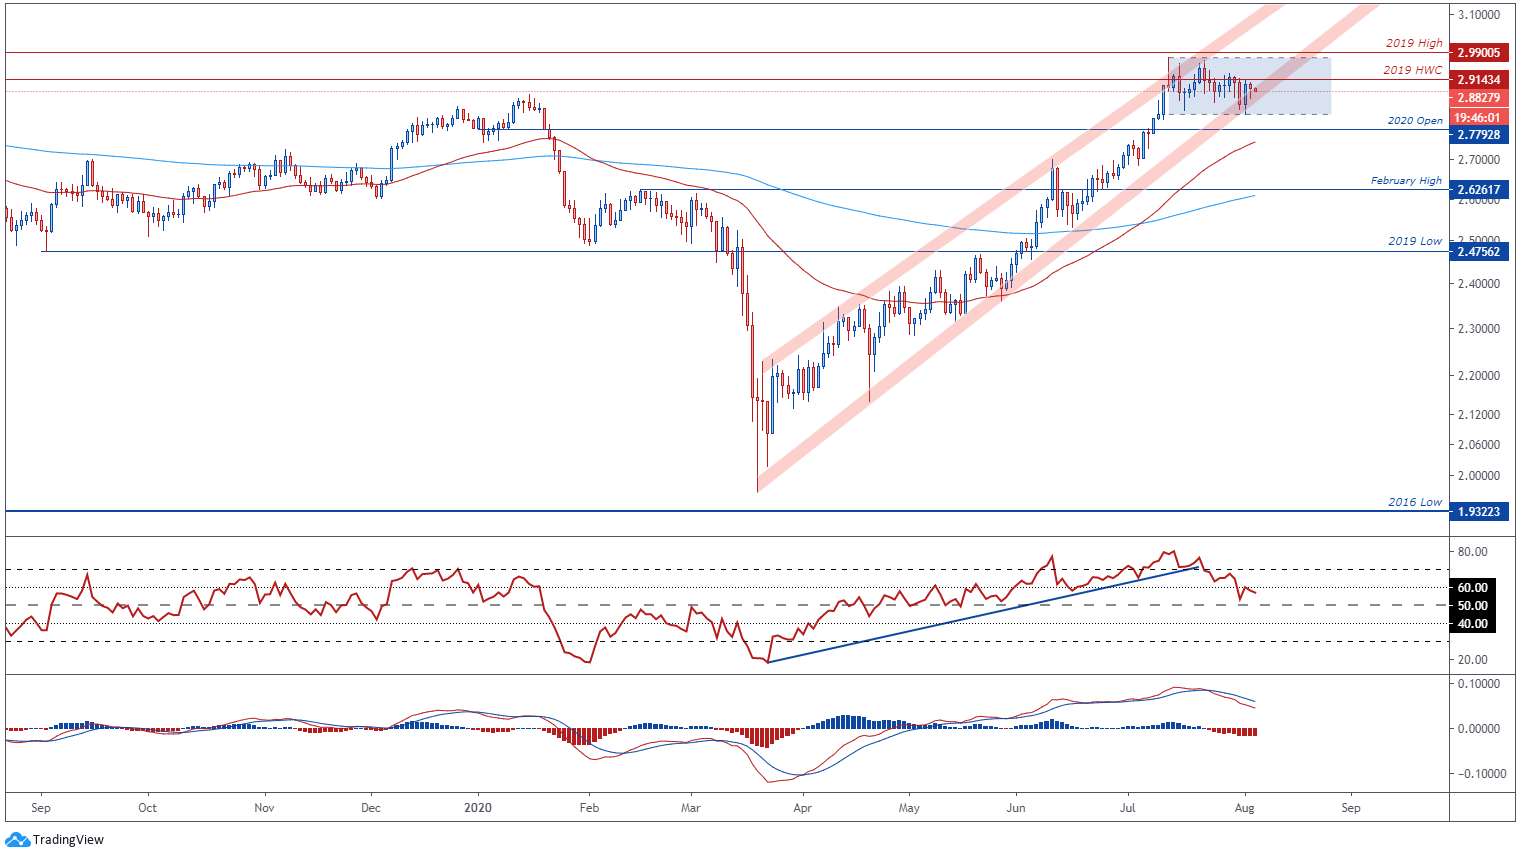
Copper daily chart created using TradingView
From a technical perspective, the outlook for copper prices remains skewed to the upside as price continues to respect the Ascending Channel that has guided price higher for the better part of four months.
However, a short-term pullback looks to be on the cards as the RSI slides below 60 and the ‘faster’ MACD line crosses below its ‘slower’ counterpart.
A break of channel support could result in price falling back to the monthly low (2.8194), with the RSI diving below 50 probably coinciding with a sustained decline to the yearly open (2.7792).
On the other hand, bullish momentum may intensify should the RSI fail to slice through its neutral midpoint and support hold at the August low (2.8914), potentially generating a push back towards the 2019 high (2.99).
Copper (XCU/USD) Weekly Chart – Technical Indicators Remain Bullish
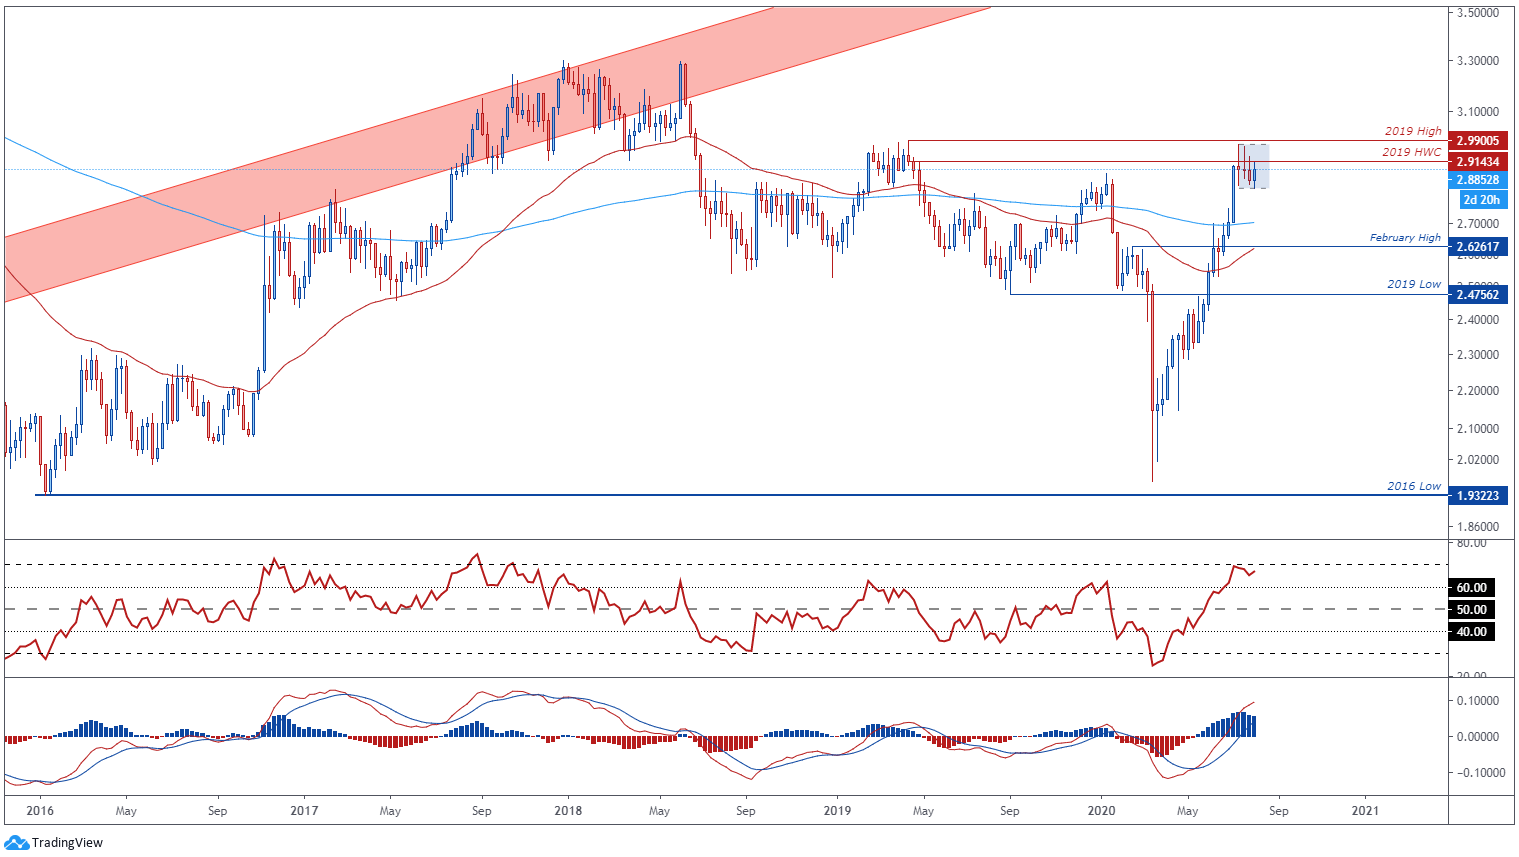
Copper weekly chart created using TradingView
Zooming out to a weekly timeframe reinforces the longer-term bullish outlook for the commodity as the RSI and MACD indicators surge to their highest respective levels since late-2017.
Moreover, the gradient of the trend-defining 50-week moving average (2.6140) hints at building bullish momentum and could fuel further buying should it cross above its 200-week (2.7022) counterpart in the coming months.
To that end, although a short-term pullback looks likely in the near-term, copper remains poised to trek higher in the latter half of 2020.
A weekly close above key resistance at the 2019 high (2.99) is needed to validate bullish potential and would probably signal a resumption of the yearly uptrend.
-- Written by Daniel Moss, Analyst for DailyFX
Follow me on Twitter @DanielGMoss


