


Technical Outlook:
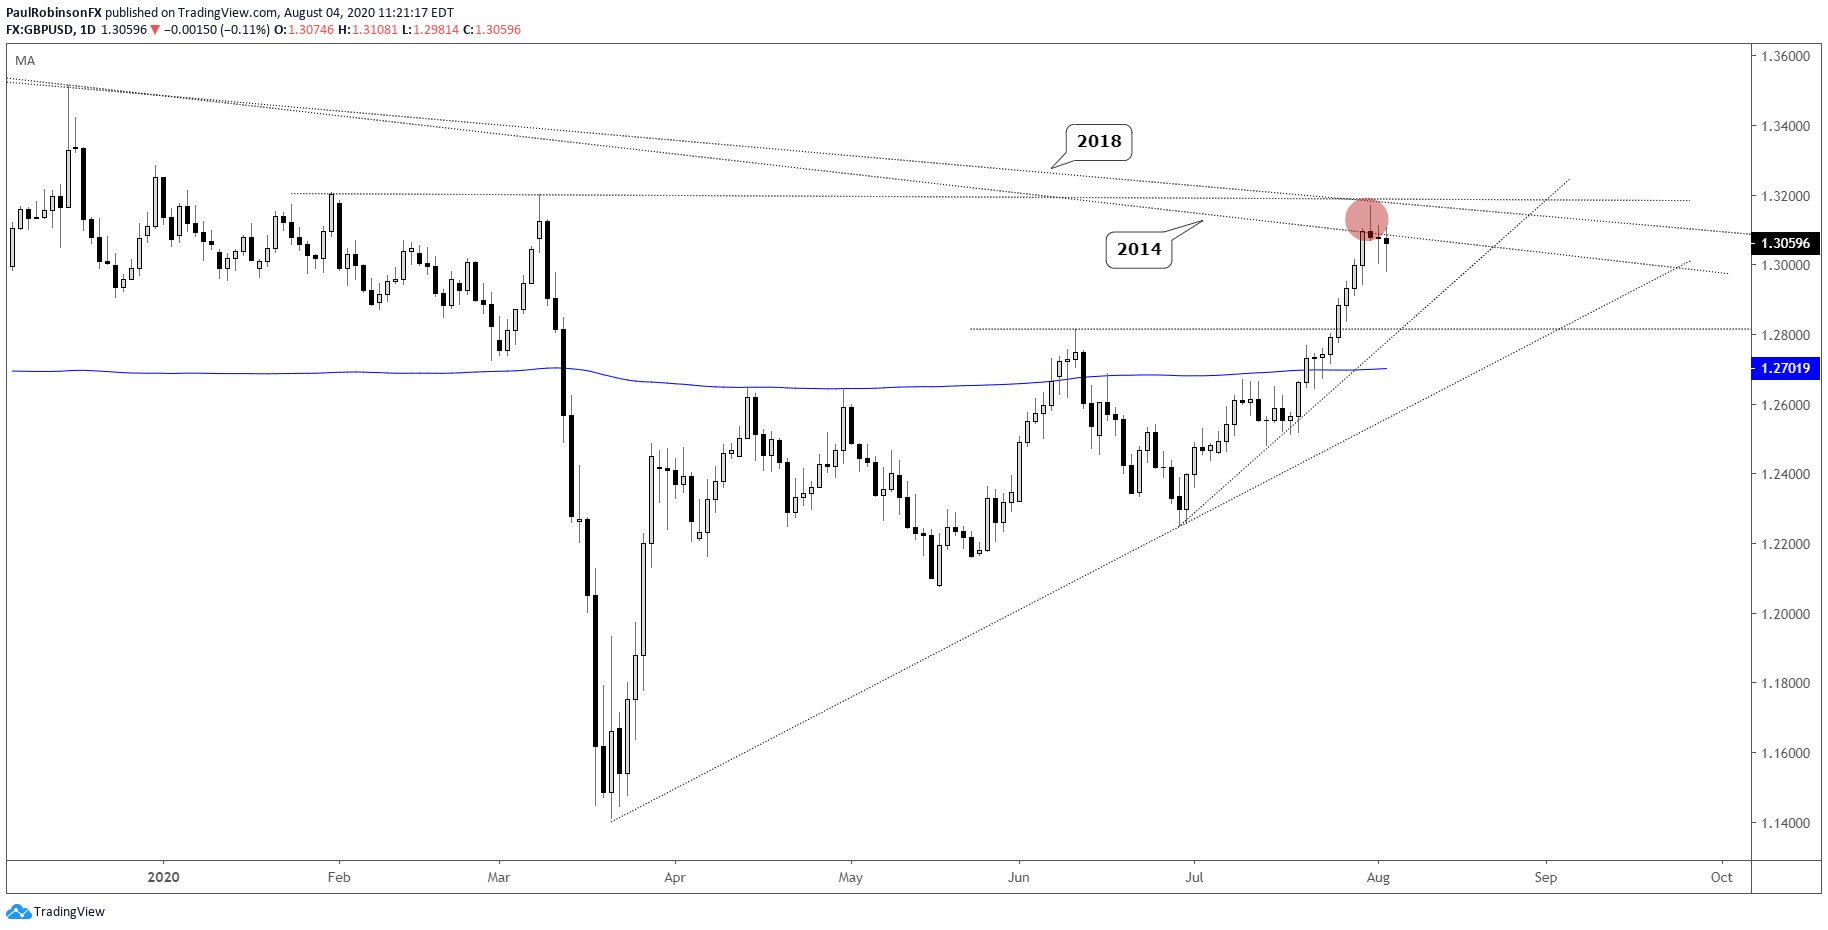
The GBP/USD chart is turning lower from confluent resistance constructed with trend-lines from 2014 and 2018 that are also in alignment with a pair of swing levels created prior to the March corona collapse. For now resistance is holding price down after a strong run, but if Cable can hold up and consolidate beneath it, at some point it might be ready to blast on through. Some time will do it good to work off overbought conditions and build up some fire power for a breakout. A breakout well into the 13200s should do the trick in getting another run going higher. Should we see weakness, watch how price reacts at the trendline from the late-June swing-low.

GBP/USD Daily Chart (at confluent resistance)
The US Dollar Index (DXY) recently went heavily oversold along with market sentiment becoming very one-way bearish. This is leading to a period of recovery and digestion, but it is anticipated that this will be all it is as the broader trend looks like it wants to continue. For now, letting the short-term plays itself out with a watchful eye for a consolidation pattern of some sort to develop that offers good risk/reward on continuation trades.
US Dollar Index (DXY) Daily Chart (may consolidate)
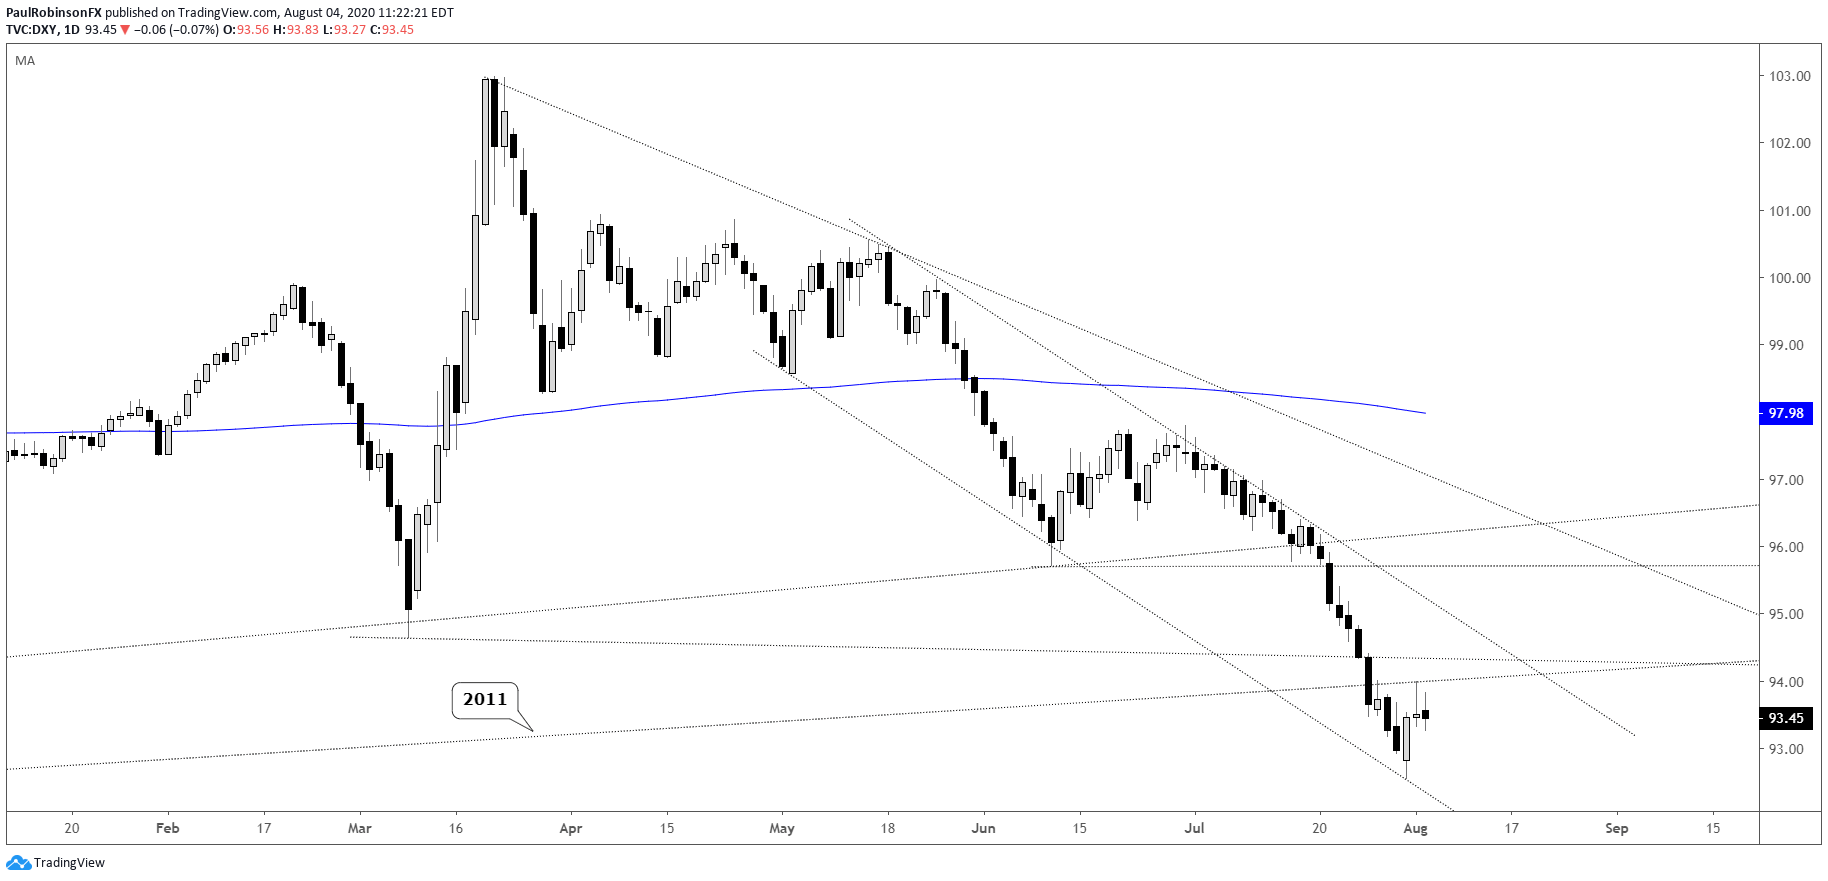
US Dollar Index (DXY) Chart by TradingView
For all the charts we looked at, check out the video above…
Resources for Forex Traders
Whether you are a new or an experienced trader, DailyFX has several resources available to help you; indicator for tracking trader sentiment, quarterly trading forecasts, analytical and educational webinars held daily, and trading guides to help you improve trading performance.
---Written by Paul Robinson, Market Analyst
You can follow Paul on Twitter at @PaulRobinsonFX


